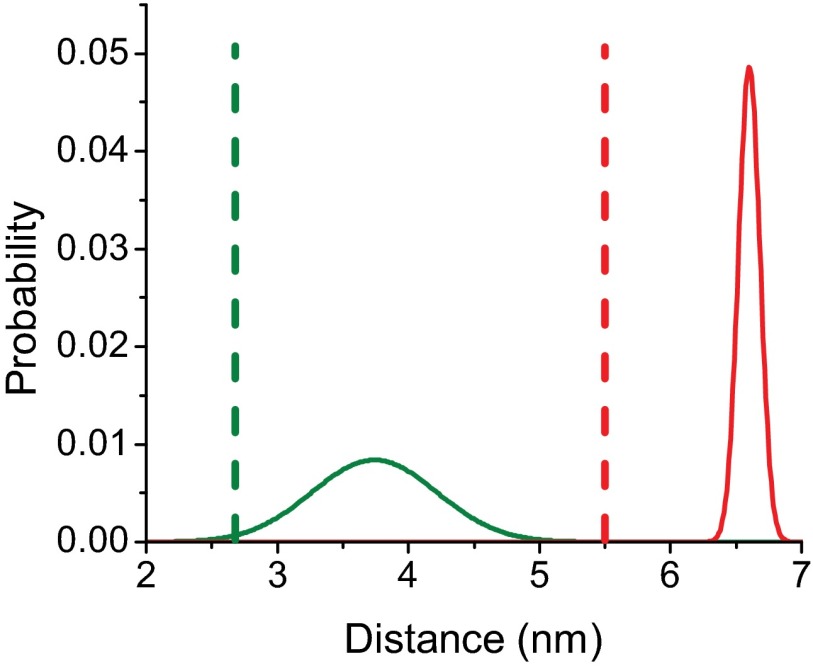
Fig. 4.
Interprobe distances measured by TR-FRET. Postpower stroke (green) and prepower stroke (red) distances and distance distributions measured by TR-FRET (solid lines) in the MV-F.QSY construct (SI Appendix, Table S2). Dotted lines correspond to the distances determined in the crystal structure of the pre- and postpower stroke states, respectively, as shown in SI Appendix, Fig. S11.

