Fig. 2.
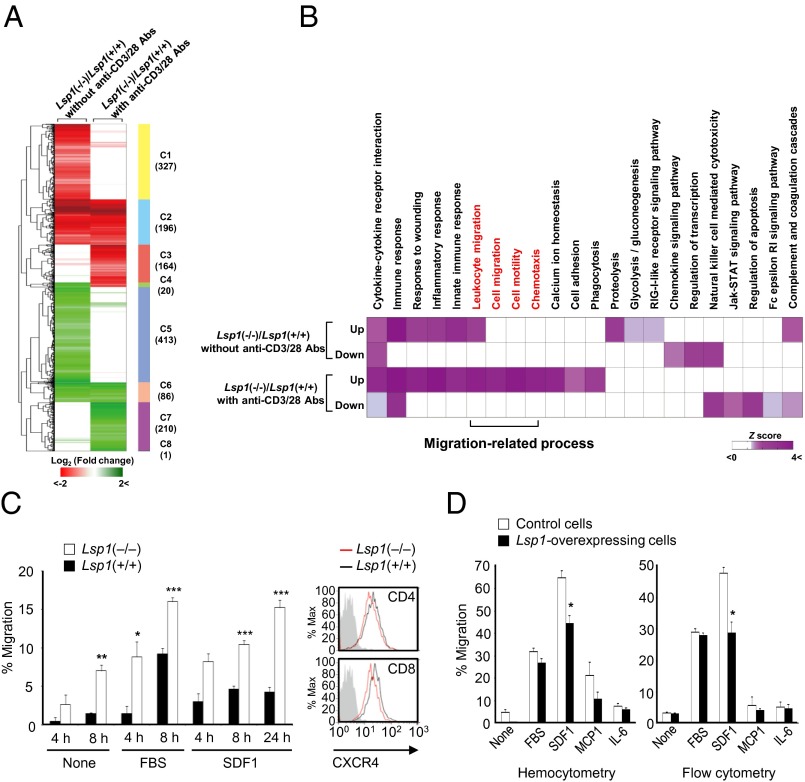
LSP1 inhibition of T-cell migration. (A) Hierarchical clustering of DEGs in the two comparisons: Lsp1(−/−)/Lsp1(+/+) without anti-CD3/28 Abs (first column) or Lsp1(−/−)/Lsp1(+/+) with anti-CD3/28 Abs (second column). After hierarchical clustering using Euclidean distance as a dissimilarity measure and complete linkage method, we identified eight clusters (C1-C8) that reflect all possible combinations of up-regulation (red) and down-regulation (green) patterns of the DEGs in the two comparisons (SI Appendix, Table S3). The numbers in parentheses show the number of DEGs in each cluster. Color bar indicates the gradient of log2 fold change. (B) Heat map shows Gene Ontology biological processes (GOBPs) and Kyoto Encyclopedia of Genes and Genomes (KEGG) pathways represented by up- or down-regulated genes in Lsp1(−/−) T cells, compared with Lsp1(+/+) T cells, in the absence and presence of anti-CD3/28 Abs. Color bar indicates gradient of Z score N−1(1 − P) where P is P value computed by DAVID and N−1(⋅) is the inverse standard normal distribution. Migration-related GOBPs or KEGG pathways are labeled in red. (C) In vitro migration of CD4+ T cells (5 × 10⁵ cells) obtained from the spleens of Lsp1-deficient (n = 5) and WT mice (n = 5). Migration assays were performed in transwell chambers in the presence or absence of SDF1α (100 ng/mL) or 10% (vol/vol) FBS in triplicate. The results are the mean ± SD. Expression of CXCR4 (a specific SDF1 receptor) determined by flow cytometry is presented on the right. Gray-colored histogram indicates isotype control. (D) Suppression of SDF1-induced T-cell migration by LSP1 overexpression. Human recombinant SDF1α (100 ng/mL), MCP-1 (100 ng/mL), IL-6 (100 ng/mL), or 10% FBS was added to the lower chamber of the transwell inserts. The Jurkat T cells (1 × 10⁶ cells) were loaded to the upper chamber and allowed to migrate for 4 h. The number of migrated cells were counted manually (Left) or determined by flow cytometry analysis (Right).

