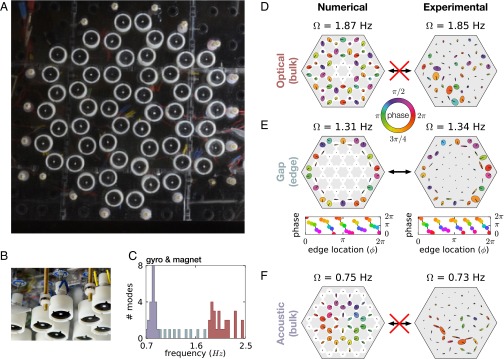
Fig. 2.
Demonstration of robustness of edge modes in experiment. (A) A picture of the experimental system as viewed from below. (B) The edge of the experimental lattice from the side, showing the construction of the individual gyroscopes as well as the fixed magnets around the edge that provide the lateral confinement. (C) The calculated histogram of normal mode frequencies for an array of 54 gyroscopes arranged in a honeycomb lattice (no disorder) is shown. The frequencies range from 0.7 to 2.5 Hz. (D–F) A comparison of calculated normal modes in an ideal magnetic-gyroscope network (Left) as measured in an experimental system (Right). For each system a mode is shown in (D) the optical band, (E) the band gap, and (F) the acoustic band. Disorder has a strong effect on bulk mode profiles. However, the gap mode profiles correspond much more closely to the ideal modes in shape, orientation, and phase of the gyroscope orbits.

