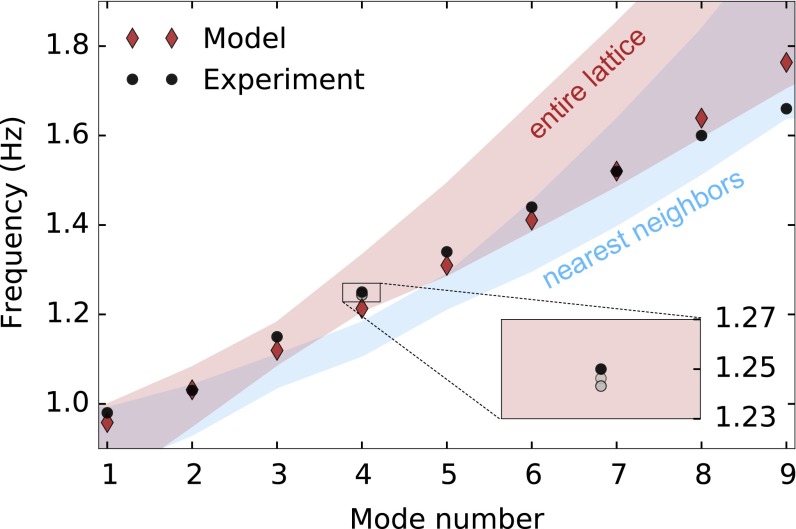
Fig. S5.
A comparison between the experiment and magnetic model for gap mode frequencies. The red (blue) shaded region indicates the possible values of gap mode frequencies for mode numbers 1–9 from calculations using measured m and values with entire lattice (nearest-neighbor) coupling. Mode numbers 1–9 are observed in the experiment with a gap extending from Hz. Modes 8 and 9 show some mixing with bulk modes. The diamonds show values for a theoretical model with Am2 and mm, corresponding to Hz (with entire lattice coupling). For this system, Hz, which was determined by measuring a single gyroscope. (Inset ) The change in frequency observed when the mode amplitude is increased from mm (measured as the largest displacement of a single gyroscope).

