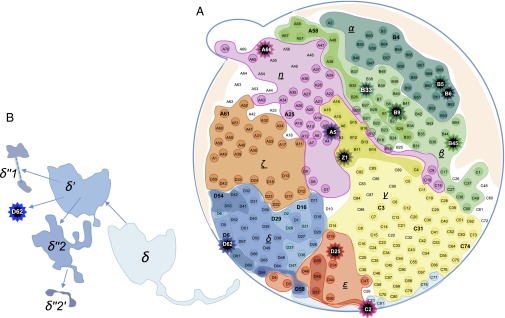
Fig. 2.
Map of the mutation clones of HCC-15. A mutation clone is the aggregate of all samples carrying that mutation (main text). Hence, subclones (with increasingly darker hues) are nested within their parent clones. (A) Each star symbol indicates a singleton clone, represented by one sample. The clonal boundaries are delineated by the genotypes of all 286 samples. Many samples straddle two clones (including A3, B17, B19, B20, C78, D6, D9, and Z1). In this “sectoring” pattern of growth, δ′ grew outward from δ and, subsequently, δ′′s (−1, −2) grew outward from δ′. Note that tumors grew in three-dimensional (3D) space but the observations made were on a two-dimensional (2D) plane. This was apparent in the “northeast” direction, along which both the α and β clones were extending from the interior toward the periphery. It appears that α grew above or below β in their expansion toward the periphery. (B) The δ lineage clones are pulled out to display the overlaying pattern of mutation clones. The clonal map was also used to compute the mutation frequency spectrum, ξi, which is the number of sites where the frequency of the mutation was between (i − 1)/23 and i/23 from the 286 samples. We kept the number of frequency bins at 23 because the mutations discovered remained based on the initial 23 samples. The spectrum, as given in the text, is [ξi = 26, 7, 1, 1, 0, 0, …] for i = 1–22 (Materials and Methods, section 9 and Dataset S8).

