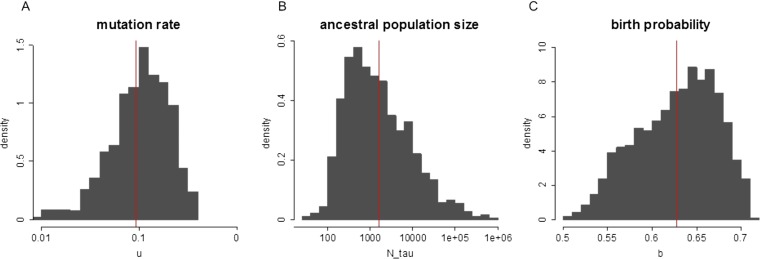
Fig. S8.
Posterior histograms of parameters by ABC inference. (A) u, mutation rate per cell division in the coding region; (B) Nτ, ancestral population size during the growth of HCC-15; (C) b, the probability that a cell has two offspring in each generation in the discrete-time branching process. The exponential growth rate r = ln(2b). The posterior means are u = 0.093, Nτ = 1,585, and b = 0.627 [thus r = ln(2b) = 0.226]. The red lines indicate the mean values.

