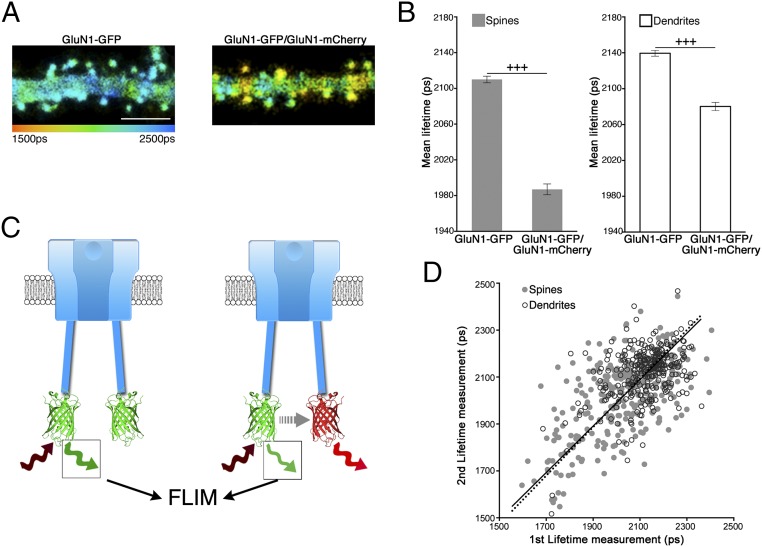
Fig. 1.
FRET between GluN1 subunits at individual NMDARs. (A) FLIM of dendrite and spines expressing indicated constructs (along with GluN2B in all figures). Pseudocolor (scale below) indicates GFP lifetime at each pixel. (Scale bar, 5 µm.) (B) Average GluN1-GFP lifetime for spines and corresponding dendritic segments (located under the spines) expressing indicated constructs; n > 20 neurons; > 400 spines (for each condition); +++P < 0.001 (Mann–Whitney). Error bars indicate SEM in all figures. (C) Model of intrareceptor FRET between GluN1-GFP and GluN1-mCherry in NMDAR; GluN2 cytoplasmic domain not shown for clarity (GluN2 N-terminal domain is dark blue). Two-photon excitation (brown), emission (green, red), and FRET (gray) energies indicated. (D) Plot of first vs. second mean lifetime measurement of GluN1-GFP/GluN1-mCherry/GluN2 expressing spines (gray circles) and dendrites (white circles with black outline). Black line is best fit minimizing both x and y distances (spines: full line; dendrites: dotted line); n = 309 spines, or dendritic segments, 17 neurons.

