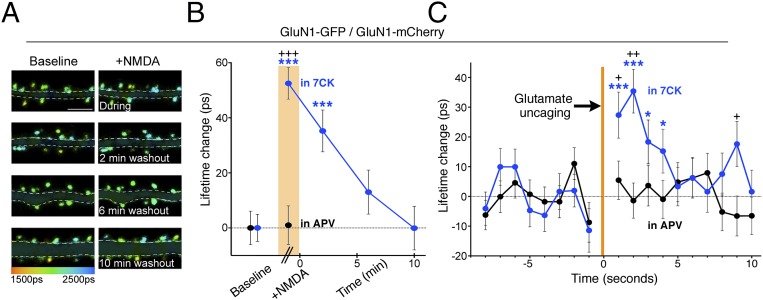
Fig. 5.
Time course of NMDA-driven conformational changes of NMDAR cytoplasmic domain. (A) Representative FLIM images of neurons expressing indicated constructs before (Left) during and after (Right) NMDA application in 7CK (Materials and Methods). (Scale bar, 5 μm.) (B) Plot of GluN1-GFP spine lifetime change, relative to baseline, in 7CK (blue) or APV (black) before, during (orange bar) and after NMDA application; n > 300–600 spines, > 13 neurons per condition; ***P < 0.001 compared with baseline value (Wilcoxon); +++P < 0.001 compared with value in APV (Mann–Whitney). (C) Plot of change, relative to baseline, in GluN1-GFP lifetime induced by glutamate uncaging (orange bar). Blue, in 7CK; black, in APV; n > 235 spines, > 35 neurons per condition; +P < 0.05, ++P < 0.01, comparing values in 7CK and APV (Mann–Whitney); *P < 0.05, ***P < 0.001 compared with baseline value (Wilcoxon).

