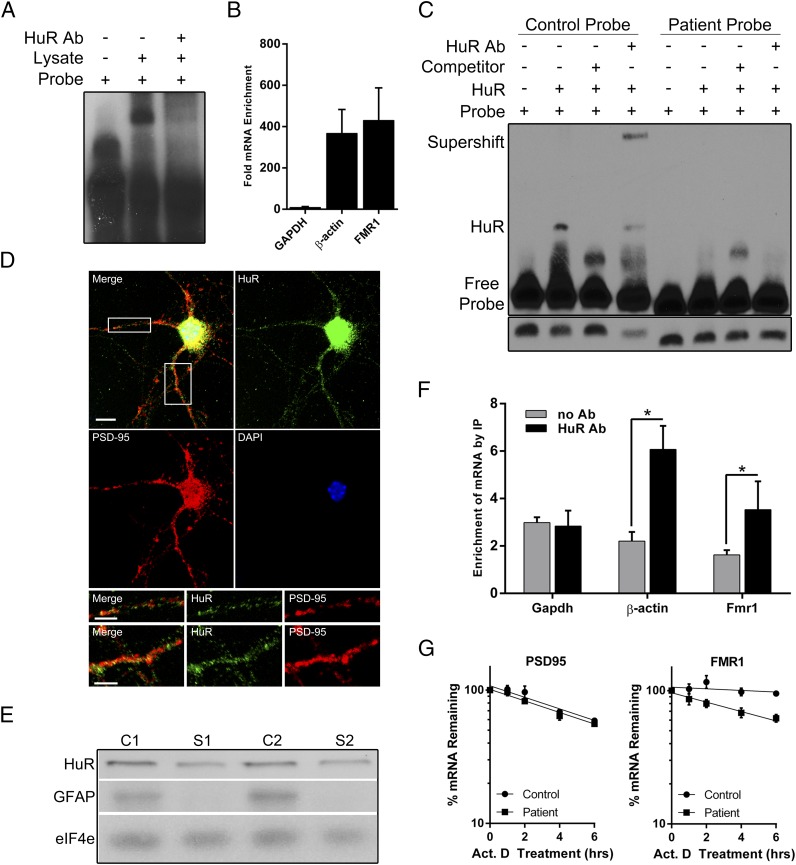
Fig. 4.
HuR binds FMR1 at the c.*746 locus and is present at the synapse. (A) Supershift assays were performed using 32P-labeled control probe and HuR antibody. Binding reactions were carried out as described previously with the addition of 0.5–1 μg of antibody per 10 μg of mouse whole-brain lysate in each reaction. (B) Immunoprecipitation of HuR protein from HEK293 cell lysate was performed, and copurified mRNAs were assayed by real-time RT-PCR. The results show the fold enrichment of mRNA levels of β-actin (a known target of HuR), GAPDH (not known to interact with HuR), and FMR1 mRNA normalized to IP with IgG alone. All data are displayed as the ratio of IP mRNA levels to input mRNA levels. Data shows the mean of three independent experiments ± SD. (C) RNA EMSA using purified HuR protein with the control or patient probe, unlabeled competitor control probe, and HuR antibody. (Bottom) Free probe bands from a shorter exposure of the same blot to ensure equal probe loading. (D) Image of immunofluorescence staining for HuR (green), PSD-95 (red), and nuclei (blue) in primary cortical neurons. A merged image of all colors is shown (Top Left). (Scale bar, 10 μm.) The white boxes in the merged image are enlarged in the Bottom two rows, with the Top row representing the Left box and the Bottom row representing the Right box. The merged, HuR (green), and PSD-95 (red) images are shown in both Bottom rows from Left to Right, respectively. (Scale bars, 5 μm.) (E) Western blot showing the presence of HuR in a whole-cortical lysate and synaptoneurosomes. GFAP, a glial marker, was used as an indicator of synaptoneurosome purity. An antibody against eiF4e was used as a loading control. C1 and S1, cortical lysate and synaptoneurosomes, respectively, of preparation 1; C2 and S2, cortical lysate and synaptoneurosomes, respectively, of preparation 2. (F) Synaptoneurosome preparations were subjected to HuR immunoprecipitation, and the level of associated Fmr1 was assayed by qRT-PCR. The levels of GAPDH and β-actin mRNA were also assayed in the immunoprecipitate as a negative and positive control, respectively. Data shown are the mean of three independent synaptoneurosome preparations ± SD. (*P < 0.05 using a two-tailed unpaired t test.) (G) Actinomycin D (5 μg/mL) was added to control and patient lymphoblastoid cells to block transcription, and qRT-PCR was performed for FMR1 (Right) and PSD-95 (Left) after 1, 2, 4, and 6 h of drug treatment as well as an untreated control (0 h). Each point shows the mean percentage of mRNA remaining relative to the 0-h control ± SEM in six independent experiments. Nonlinear regression lines were fit to each set of data points, and the slopes were calculated and compared. For FMR1, the difference in slope was significantly different between the control and patient (P = 0.008); for PSD-95, the difference in slope was not significantly different (P = 0.582).

