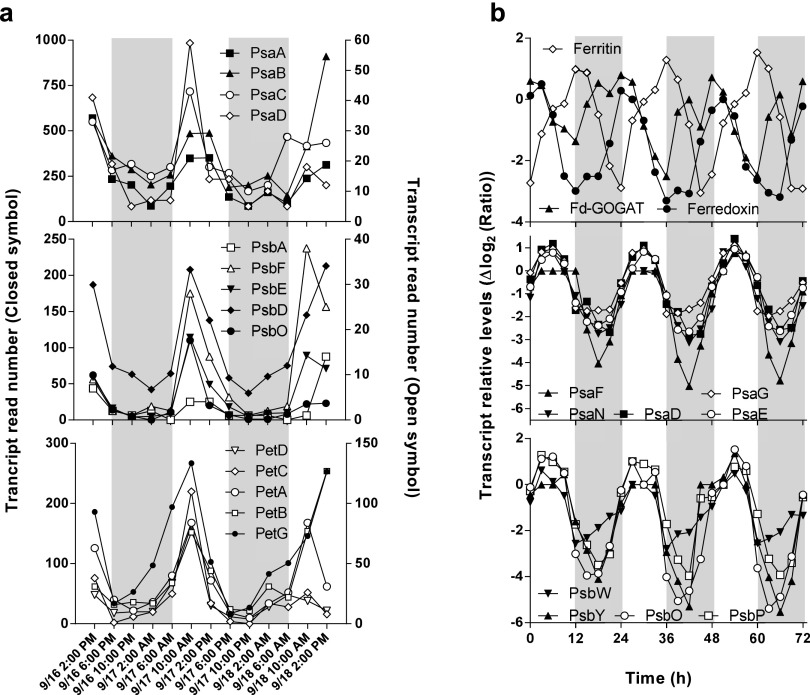
Fig. S1.
Comparison of day/night patterns of transcripts in environmental metatranscriptomic data and O. tauri cultures. (A) Transcripts abundance of Ostreococcus sp in an environmental dataset from the Pacific Coast of the United States (25). Shown are transcript read numbers for PSI (Top), PSII (Middle), and Cytb/6f (Bottom) genes. (B) Gene-expression profiles from microarray data of O. tauri cells grown under day/night conditions: ferritin/ferredoxin (Top), PSII (Middle), and PSI (Bottom) genes. Changes in gene expression are expressed in a Δlog2 ratio. In each panel gray areas represent night time; for in situ experiments, night time corresponds to periods when PAR = 0.

