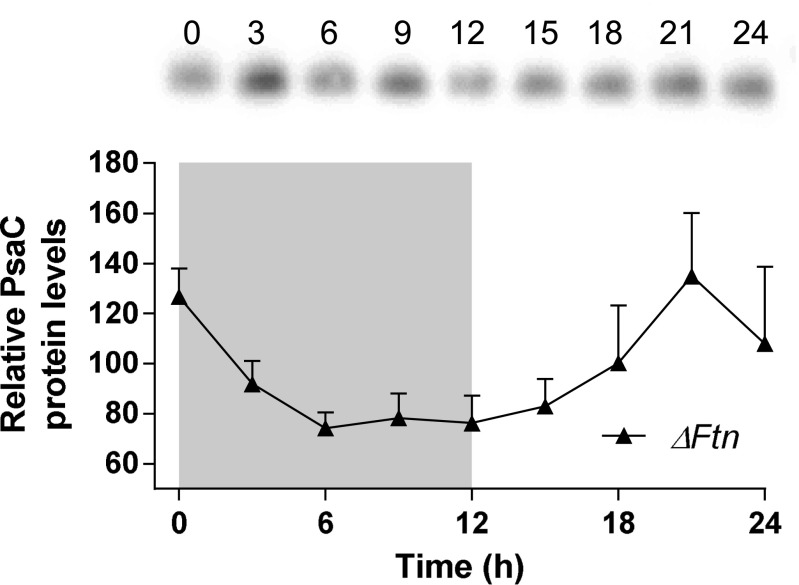
Fig. S4.
Western analysis of PsaC level under day/night conditions in in ΔFtn cells. (Upper) Western blot analysis of anti-PsaC. Cells were harvested every 3 h during a 12-h/12-h day/night cycle. (Lower) Normalized density quantization of the anti-PsaC blot. The gray area represents the night period. Data shown are means ± SD from three experiments (n = 3) expressed in percent of mean signal.

