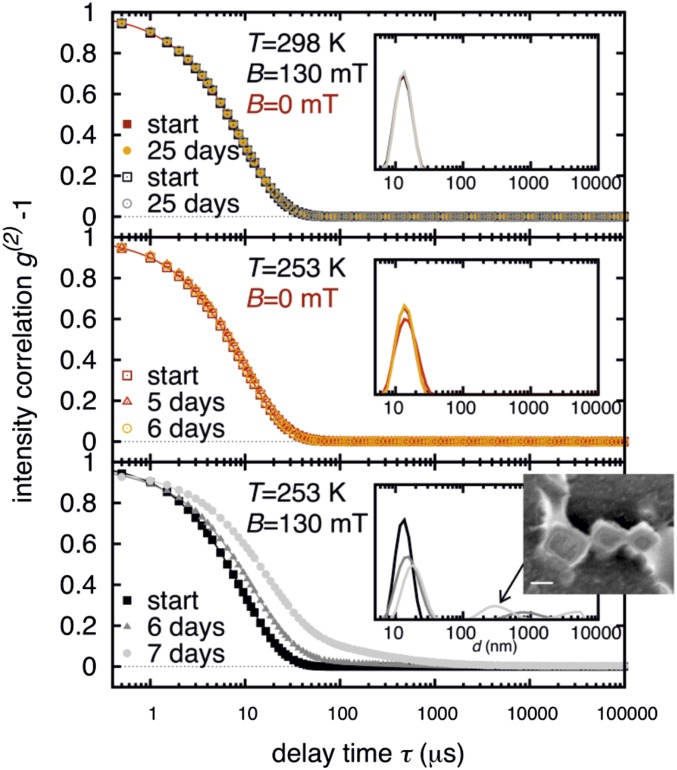
Fig. 2.
Normalized intensity correlation functions measured by DLS from a 1-wt % solution of nanoparticles in toluene (G116 in SI Appendix, Table S2). The measurements are indicated by different symbols. (Insets) The corresponding particle distributions obtained from these data. The upper four data sets were obtained at room temperature without (red and orange) and within a magnetic field of 130 mT (black and gray). The middle three data sets were obtained at a reduced temperature of 253 K without a field. Only neglectable differences between the distributions are observed. The three consecutive measurements in the lower plot document the formation of larger aggregates, which were obtained after exposing the sample to a magnetic field of 130 mT at 253 K. The ensuing peak in the distribution at about 300 nm is presumably caused by the formation of cuboids as shown in Fig. 1 and in the overlaid image.

