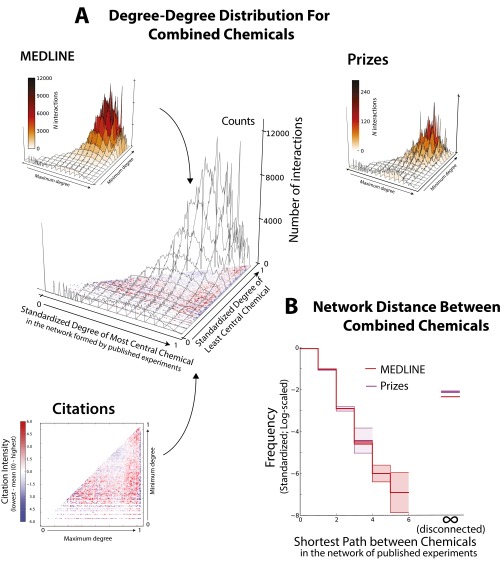
Fig. S3.
(A, Top and Middle) The distribution of node degrees for each pair of chemicals in MEDLINE abstracts and in abstracts authored by prize-winning scientists (SI Text). The (log-)degree of the most and least central chemicals of each pair is normalized to and the height of the figure represents the frequency with which each pair of chemical degrees appears in the literature. All degrees are evaluated on the full (2010) network. (A, Bottom)The “Citations” subplot shows citation counts greater and smaller than average in red and blue, respectively; the red scale has been set to the same maximum value as the blue to improve contrast. (A, Middle) The combined figure reveals how less common degree–degree combinations are more intensely cited than common degree–degree combinations. (B) Distribution of network distances between each pair of chemicals in MEDLINE abstracts and in abstracts written by prize winners. All distances were evaluated at time of linking; frequencies have been transformed to -scale. distance indicates two chemicals that are mutually unreachable—disconnected—in the current network. The red and purple bands tracing the distributions are the 95% confidence intervals, constructed by considering the actual distribution of shortest paths as a sample from an underlying multinomial distribution (SI Text). Prize winners combine disconnected molecules significantly more frequently than others.

