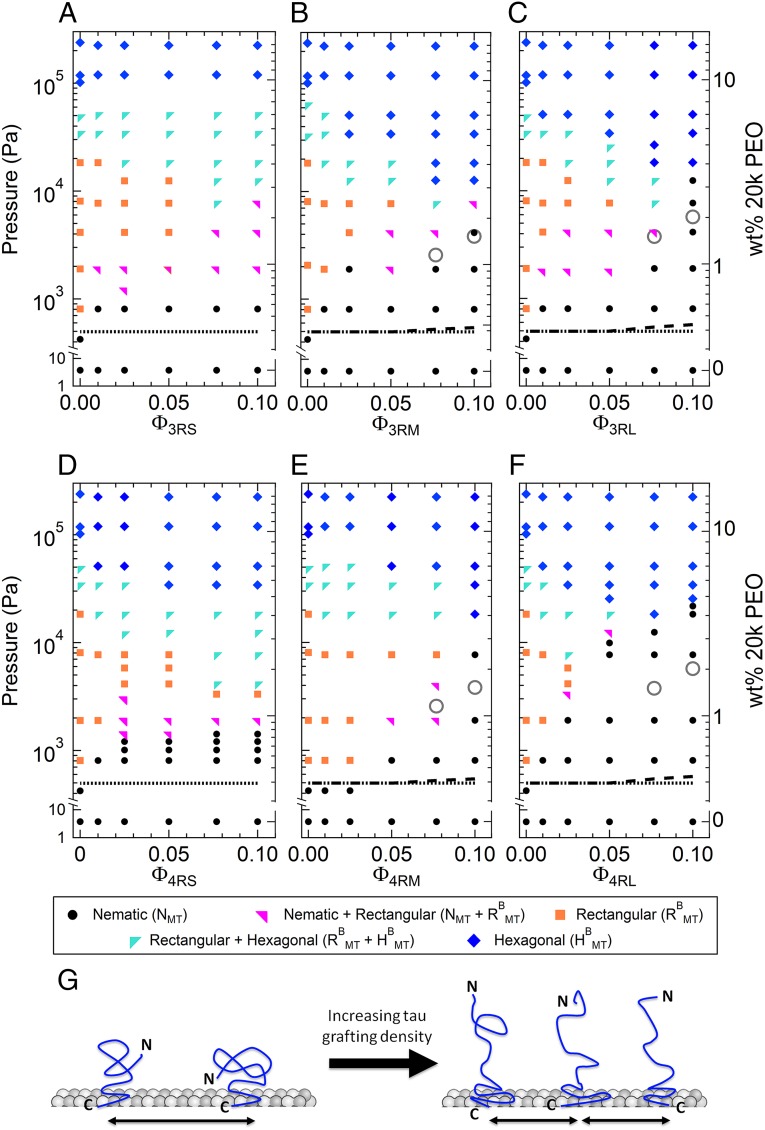
Fig. 3.
Osmotic pressure against Tau/tubulin concentration-phase diagram for all six Tau isoforms. (A–F) MT/Tau phases, determined by SAXS analysis, plotted as a function of increasing osmotic pressure (left y axis) induced by increasing weight percentage of 20k PEO (right y axis, which has independent log domains to match PEO concentrations) against various Tau/tubulin-dimer molar ratios (ΦTau) of (A) 3RS, (B) 3RM, (C) 3RL, (D) 4RS, (E) 4RM, and (F) 4RL isoforms of Tau. The observed phases were nematic (N), buckled rectangular (RBMT), or hexagonally bundled (HMT) phases or regions of phase coexistence. For isoforms with the longer PD (-M and -L), the MT bundling pressure, PB, increased abruptly at higher Tau coverages (ΦTau = 1/10). Notably, increasing Tau coverage of the 3RS and 4RS isoforms of Tau shows little effect in affecting the MT bundling pressure. As described in the text, the lines and open circles in the phase diagram correspond to the expected PB for the soft cylinder model for bare MTs (dotted line), the charged soft cylinder model for selected Tau isoforms (-M and -L) bound to MTs (dashed line), and the charged brush model for Tau for selected Tau isoforms (-M and -L) at the highest coverages (ΦTau = 1/10 and 1/13; gray open circles). (G) Cartoon depicting the (Left) mushroom and (Right) brush states of Tau’s NTT with increasing grafting density.

