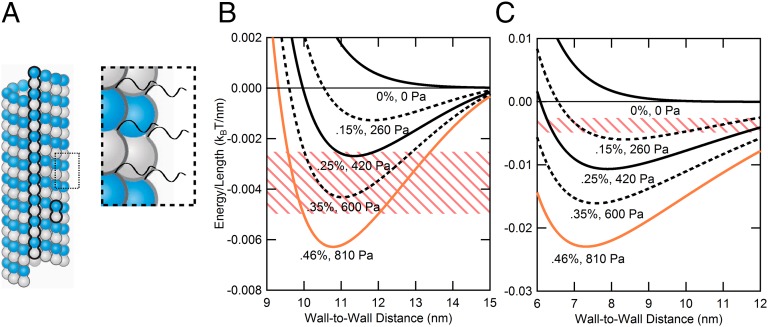
Fig. 4.
Modeling MT–MT interactions requires more than a simple charged cylinder model. (A) Schematic of bare MT and expanded view showing negatively charged C-terminal tails (CTTs) of α- and β-tubulin. The presence of CTTs on the MT surface requires the model to incorporate a soft polyelectrolyte layer above the surface of the MT. (B) Curves derived from the soft cylinder model plotted for actual PEO weight percentage used in experiments (solid lines) and in-between concentrations (dashed lines). Colors (from black to orange) are coordinated with data in Fig. 3 (ΦTau = 0). The pink-striped zone corresponds to a potential depth of 5–10 kBT for 2-µm MTs (SI Appendix, SI Note S1 and Fig. S1.6 show MT length distribution), where one would expect MT bundling. The orange curve, which falls in this zone, corresponds to the lowest pressure where MT bundles are observed in the absence of Tau (Fig. 3). (C) Assuming the same potential depth (pink-striped zone; 5–10 kBT for 2-µm-length MTs) for MT bundling, the charged hard cylinder model (i.e., all tubulin charge on the surface) predicts bundling at lower PEO concentrations compared with what is observed experimentally (between 0.25 and 0.46 wt% PEO).

