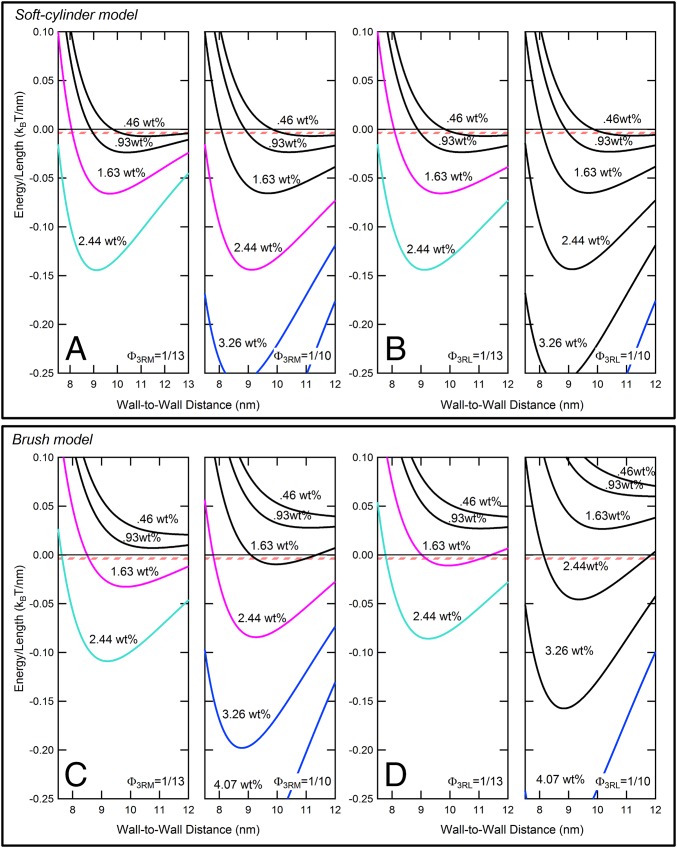
Fig. 5.
The charged brush model for Tau isoforms with longer (-M and -L) PDs better captures the bundling behavior of MT/Tau mixtures at higher Tau coverages (ΦTau = 1/13 and 1/10). Potential energy curves plotted for high coverages of Φ3RM,3RL = 1/13 and Φ3RM,3RL = 1/10 using (A and B) the soft cylinder model and (C and D) the charged brush model as discussed in the text. The curves are (Left) [0.46, 0.93, 1.63, and 2.44] wt% PEO for Φ3RM,3RL = 1/13 and (Right) [0.46, 0.93, 1.63, 2.44, 3.26, and 4.07] wt% PEO for Φ3RM,3RL = 1/10. The concentrations are those used in experiments, and the curves are color-coded as in Fig. 3, where the first colored curves indicates the PEO concentration where bundling is first observed (Fig. 3) (ΦTau = 1/13 and 1/10 for -M and -L isoforms, respectively). The pink-striped zone corresponds to a potential depth of 5–10 kBT for 2-µm MTs (SI Appendix, SI Note S1 and Fig. S1.6 shows MT length distribution), where one would expect MT bundling. Comparison between the model shows that (C and D) the charged brush model for the PD gives better qualitative agreement between theory and experiment compared with (A and B) the soft cylinder model.

