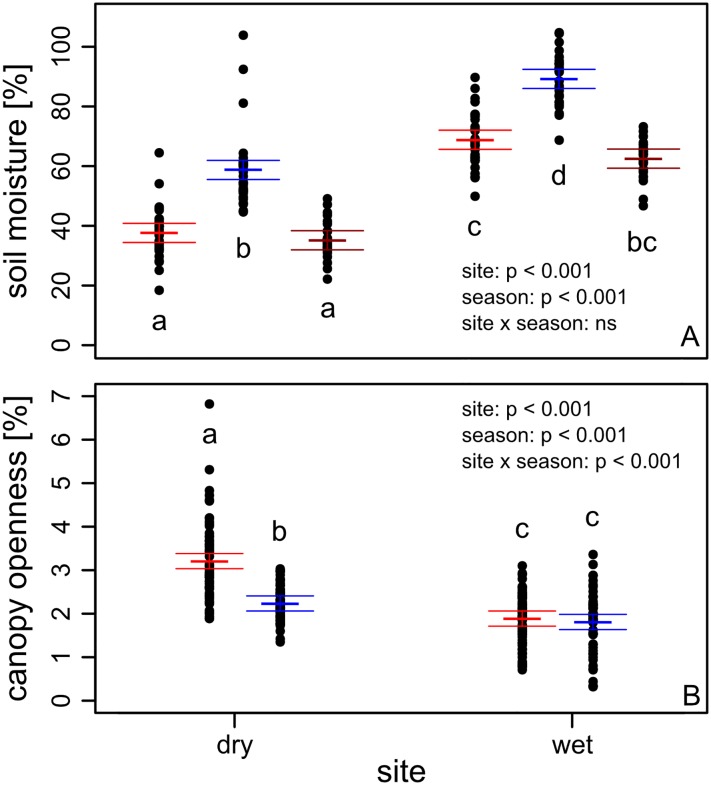
Fig 2. Gravimetric soil moisture (A) and canopy openness (B) in the dry and wet site across seasons.
Colors indicate the end of the dry season 2012 (red), wet season 2012 (blue) and dry season 2013 (dark red). Included are results of an ANOVA for effects of site, season and site x season interactions. Different letters represent significant differences at the 0.05 level in a Tukey post-hoc test. Presented are means (thick horizontal lines), 95% CI (thin lines), and raw data (points).

