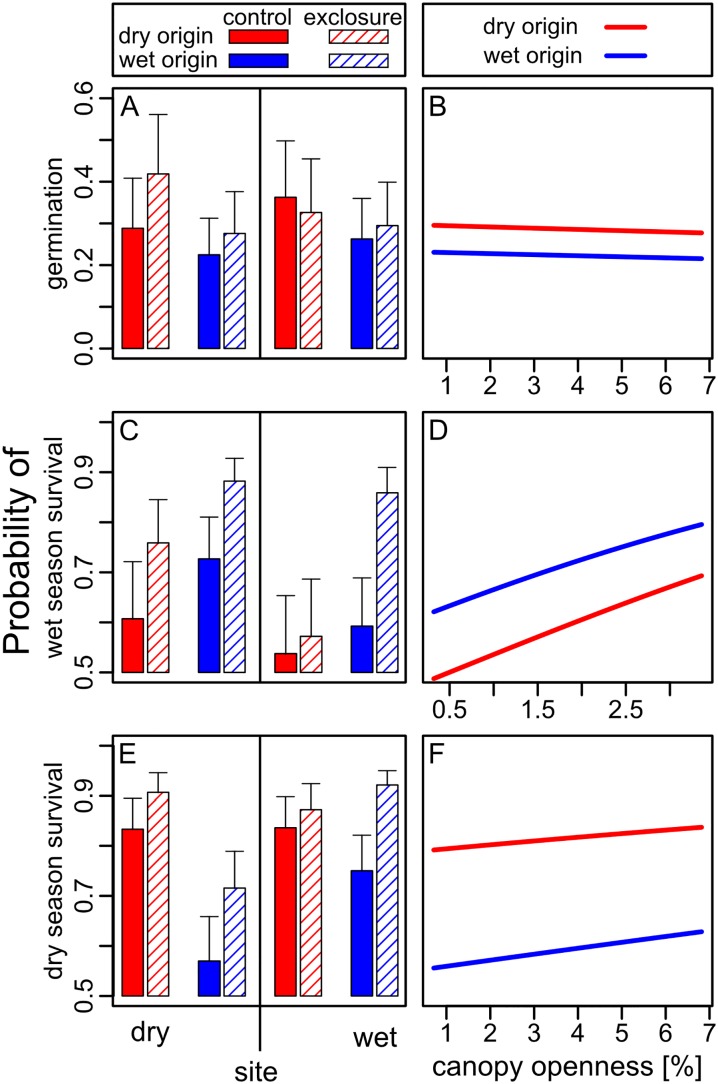
Fig 4. Probability of seed germination (A and B), wet season seedling survival (C and D) and dry season survival (E and F) for species with dry or wet origin as affected by moisture (dry vs. wet site), herbivore exposure (control vs. exclosure) and light availability (canopy openness).
Panels A, C and E show means and standard errors from the least squares means table [46]. For canopy openness, results of exclosure and control seeds and seedlings were pooled (see also Fig 3). For overall analyses see Table 1, for planned contrasts (post-hoc-tests) see Table 2.

