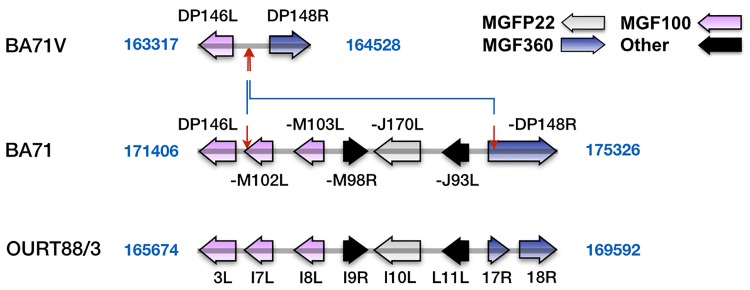
Fig 6. Comparison of the genomic structure of BA71 with BA71V and OURT88/3 around difference 49.
The figure shows a representation to scale of the genomes of BA71, BA71V and OURT88/3 around the position of BA71-BA71V difference 49 (the exact positions are indicated for each of the genomes). Red arrows delimit non-identical regions. Blue lines connect arrows at equivalent positions. The different groups of ORFs are identified by colors as shown in the figure. The dash at the beginning of the names of some ORFs indicates where the prefix BA71- has been removed to avoid clutter.

