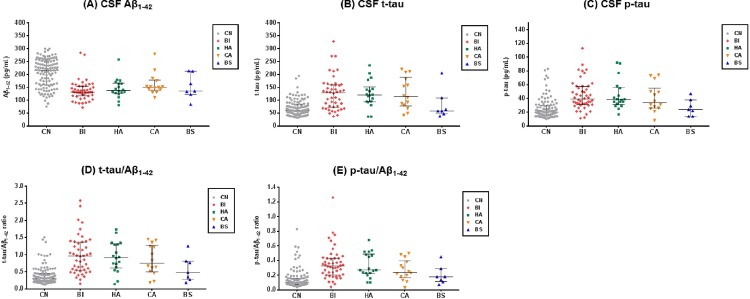
Fig 3. CSF biomarker levels.
The dot plots of CSF biomarkers in CN and AD subtypes. Bars indicates median and IQR. (A) CSF Aβ1–42, (B) CSF t-tau, (C) CSF p-tau, (D) t-tau/Aβ1–42 ratio, (E) p-tau/Aβ1–42 ratio. CN, Cognitively normal; AD, Alzheimer’s disease; BI, Both impaired; HA, Hippocampal atrophy only; CA, Cortical atrophy only; BS, Both spared; CSF, Cerebrospinal fluid; Aβ1–42 = Amyloid-β 1–42 peptide; t-tau, total tau; p-tau, phosphorylated tau.

