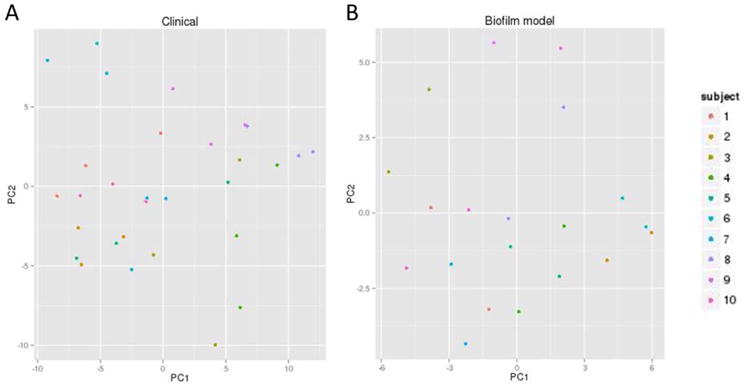
Figure 4.

Principal Component Analysis plots of the 16S rRNA HOMIM probes across A) the clinical time points (V1,V2, V3) and B) the two biofilm time points (V2NT and V2T). Samples from the same subject tend to co-localize in the plot, which indicated that there was some reproducibility of the plaque ecology over time in the same subject.
