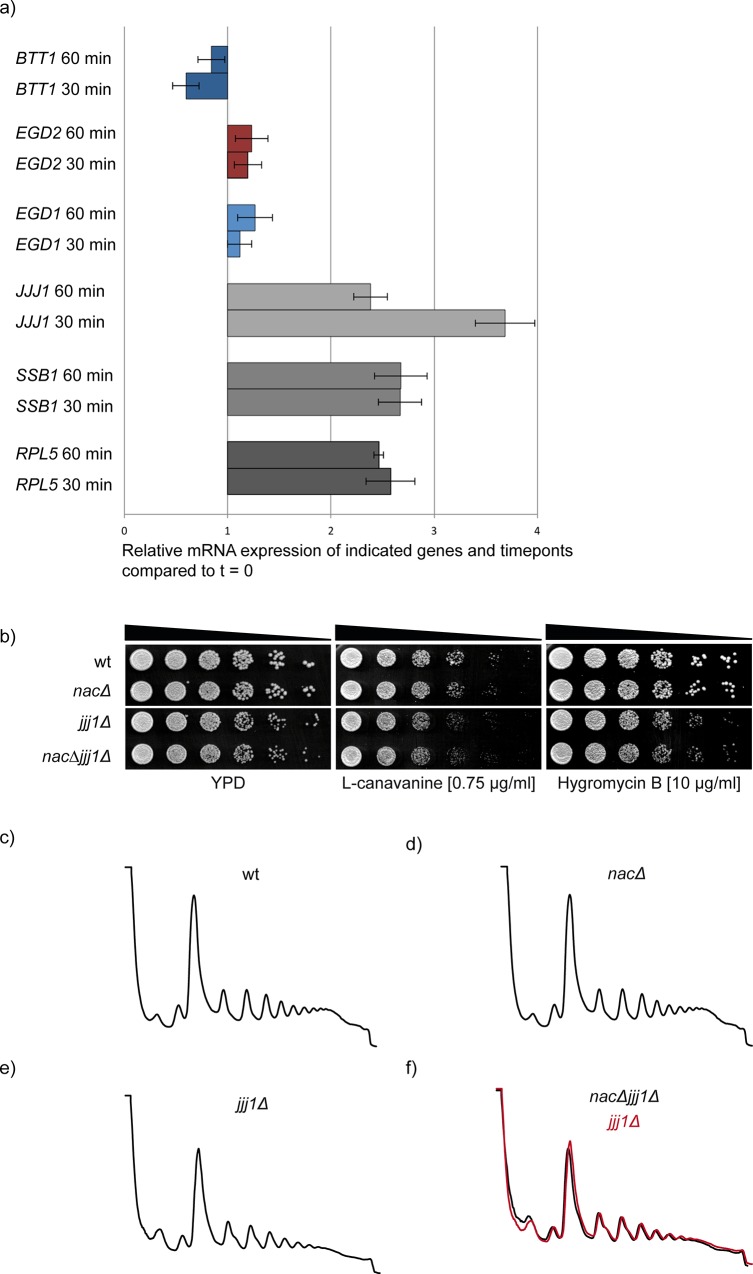
Fig 5. NAC is not coregulated with genes encoding ribosomal proteins.
a) X-axis: Relative mRNA levels of indicated genes and time points compared to timepoint zero (t = 0, before glucose addition) and normalized to an internal control (housekeeping gene). Cells were harvested at 0 min, 30 min and 60 min after glucose addition and mRNA was extracted. cDNA was obtained by reverse transcription and used for qRT-PCR. b) Serial dilutions of wild type (wt) and chaperone mutant cells were spotted on YPD plates and plates containing the indicated drugs for growth analysis. When cells were plated on the arginine analogue L-canavanine, arginine was omitted. The cells were incubated for 3 days at 30°C. c) Polysome profiles of wt and mutant cells. 10 A260 units of lysates of indicated yeast strains were loaded onto 15–45% linear sucrose gradients as shown in Fig 3. The profiles are representative for three independent runs.

