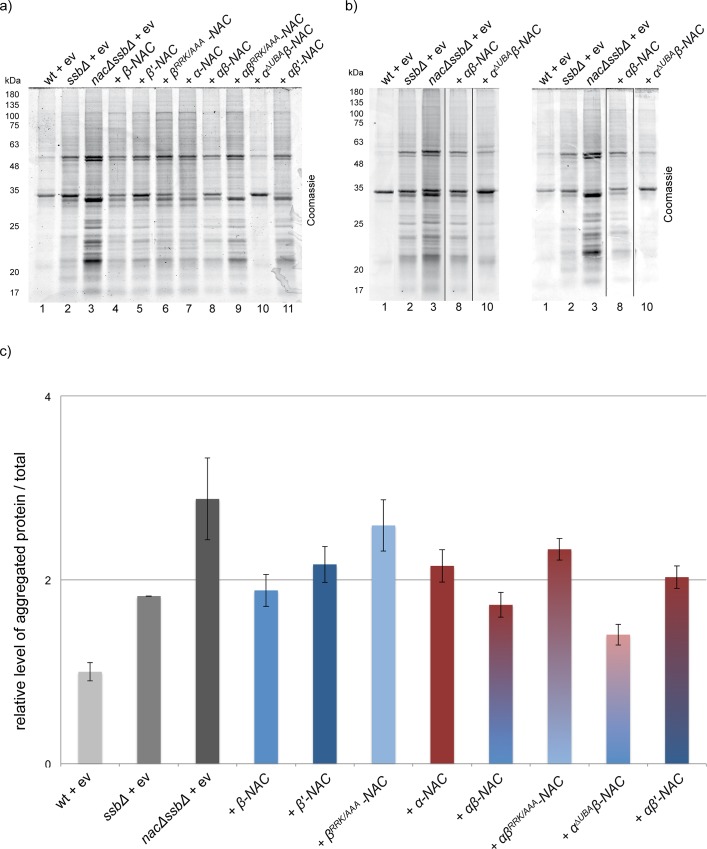
Fig 6. Analysis of protein aggregation in nacΔssbΔ suppressed by NAC variants.
a) 50 OD600 units of transformed yeast cells expressing the indicated NAC variants in the logarithmic phase were lysed and the aggregated protein material was isolated by sedimentation. Isolated aggregated fractions were separated by SDS-PAGE and visualized by Coomassie staining. b) Biological replicates of the experiment shown in a) for aggregated proteins of wt, ssbΔ and nacΔssbΔ cells (lanes 1–3), nacΔssbΔ + αβ-NAC (lane 8) and + α ΔUBA β-NAC (lane 10). The experiment was performed as in a). For better visualization the corresponding lanes were cut out from the same SDS-PAGE after Coomassie staining as indicated by black lines. c) Quantification of aggregated material using ImageJ shows the relative level of aggregated protein in relation to total protein amount, normalized to the mean value of wt replicates. Mean ± SD is shown from three experiments (n = 3).

