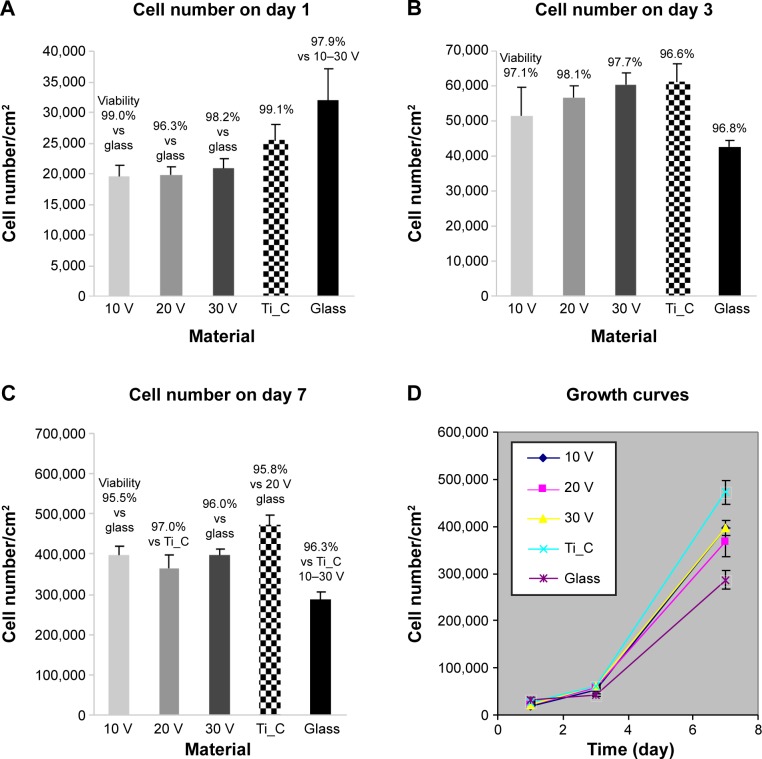
Figure 5.
Densities and viability of human Saos-2 osteoblasts on 10 V, 20 V, and 30 V nanotubes.
Notes: Control Ti_C and glass coverslips on days 1 (A), 3 (B), 7 (C), and cell growth curves on these surfaces (D). Data expressed as mean ± standard error of mean from six measurements. P≤0.05 considered significant in comparison with samples labeled above columns.

