
Figure 2.
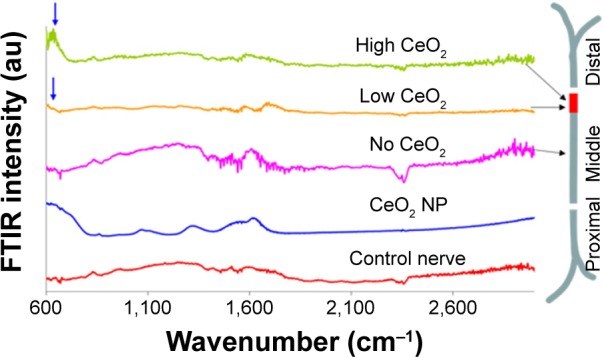
FTIR traces from different regions of CeO2-treated sciatic nerve of the frog.
Notes: Arrows indicate CeO2 presence compared to control (CeO2 NP). Peaks approximately 1,640 cm−1 are attributed to the ν2′ band of the hydrogen bond of water.
Abbreviations: FTIR, Fourier transform infrared microscopy; NP, nanoparticle.