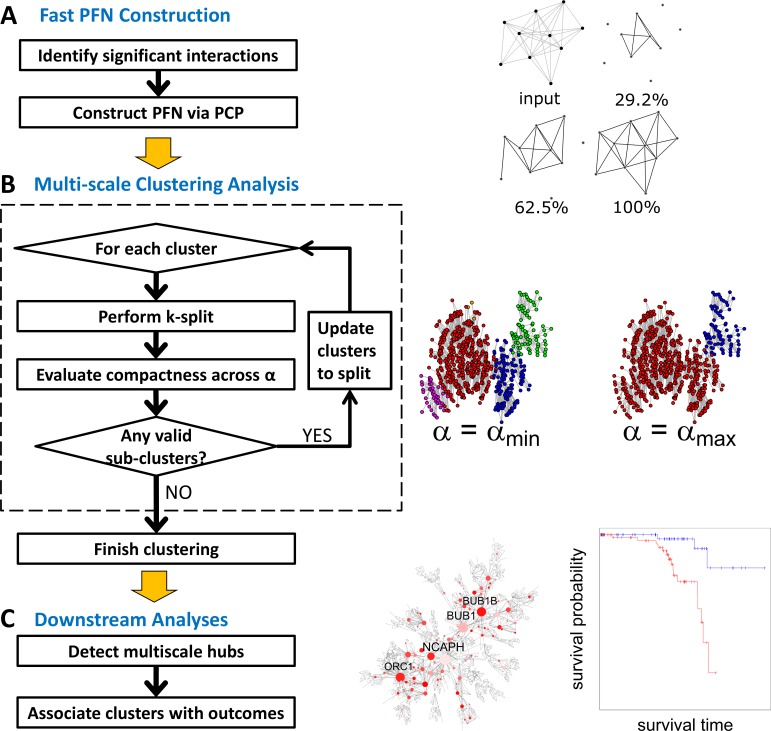
Fig 1. Flow chart of MEGENA.
A) Fast planar filtered network construction. Significant interactions are first identified and then embedded on topological surface via a parallelized screening procedure described in the text. On the right, a toy example is illustrated to show construction of PFN from a thresholded network by FDR (top left), and gradual construction of PFN with number of included links and screened pairs shown on the top of each. B) Multi-scale clustering: Beginning from connected components of the initial PFN as the parent clusters, clustering is performed for each parent cluster and compactness of the sub-clusters are evaluated. These steps are described in the dotted box. The clustering is performed iteratively until there remains no further parent clusters meaningful to split. C) Downstream analyses: Multiscale Hub Analysis (MHA) is performed to detect significant hubs of individual clusters and across α, characterizing different scales of organizations in PFN. Then, clusters are ranked by associations to clinical traits including enrichment of differentially expressed gene (DEG) signatures, and correlations to survival end-point etc.

