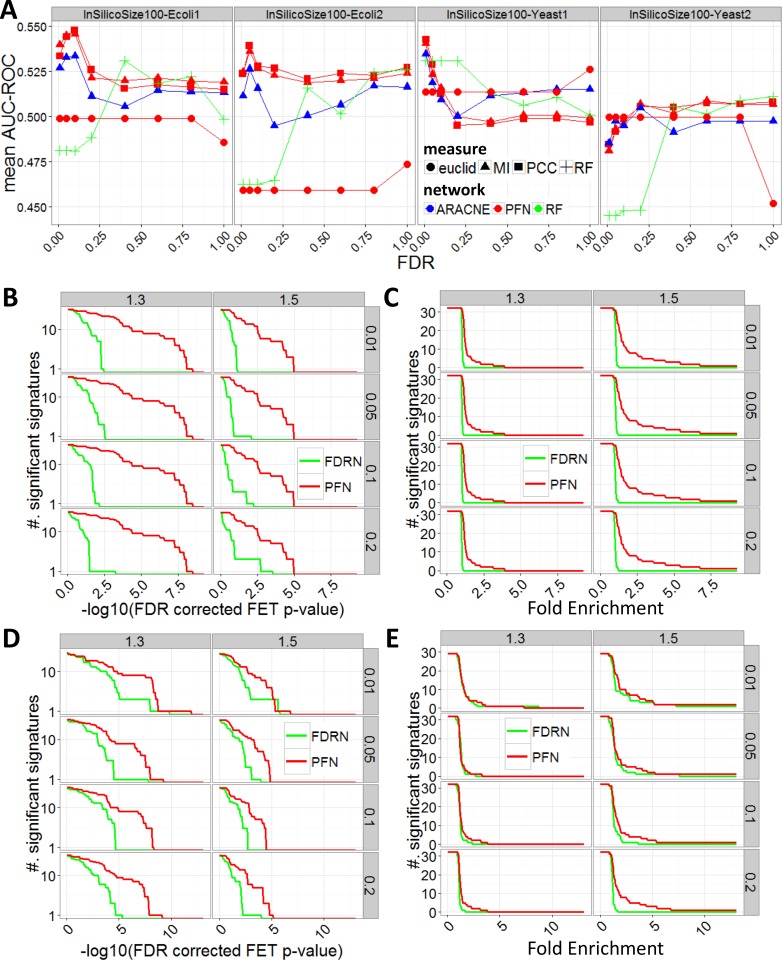
Fig 3. Validation of PFNs in comparison to various network inference methods.
A. Comparisons of AUC of ROC for weighted shortest path distances of inferred networks from simulated data from various golden standard networks (labeled on the top), in comparison to ARACNE and RF. Different combinations with Pearson’s correlation coefficient (Pearson), mutual information (MI) and Euclidean distance (Euclid) were tested. B-C. Comparison of BRCA TF knock down signatures on BRCA PFN (red) and FDRN (green) neighborhoods of the target TFs, inferred from MI. The strips on the top of each plot shows expression fold changes (1.3 and 1.5 respectively) to derive these signatures. B shows FDR corrected FET p-values against the number of significantly enriched signatures. C shows enrichment fold change cut-off against the number of significantly enriched signatures. D-E. Comparisons of BRCA TF knock down signatures on inferred networks from PCC. D and E correspond to FDR corrected FET p-values and enrichment fold changes, similarly to B and C.

