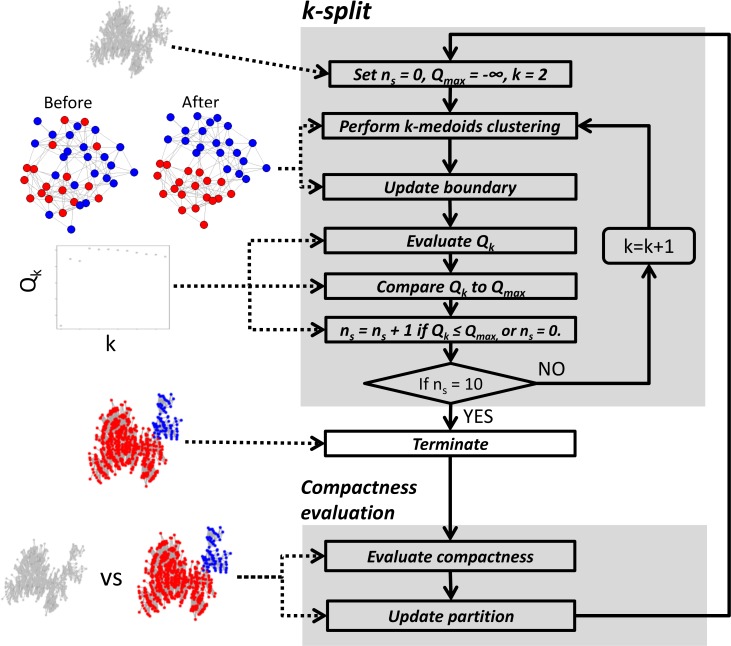
Fig 13. Flow chart of the clustering analysis procedure for each value of compactness resolution parameter, α.
The upper panel illustrates the k-split procedure within each cluster to detect optimal sub-clusters. The lower panel describes the compactness evaluation procedure (CEP) after k-split. CEP compares the parent cluster prior to k-split with the sub-clusters after k-split by means of the compactness measure, ν l, and updates the partition accordingly. On the left, each step is illustrated by a graphical toy example. From the top, the pictures correspond to: the initial network subject to clustering, correct classification of boundary nodes by BDP (Before: before BDP, After: correction after BDP), identification of the optimal k via modularity Qk, final clusters, and comparison between initial network and sub-clusters via compactness. These steps are iterated for all clusters from the newly updated partition until no further update can be made.

