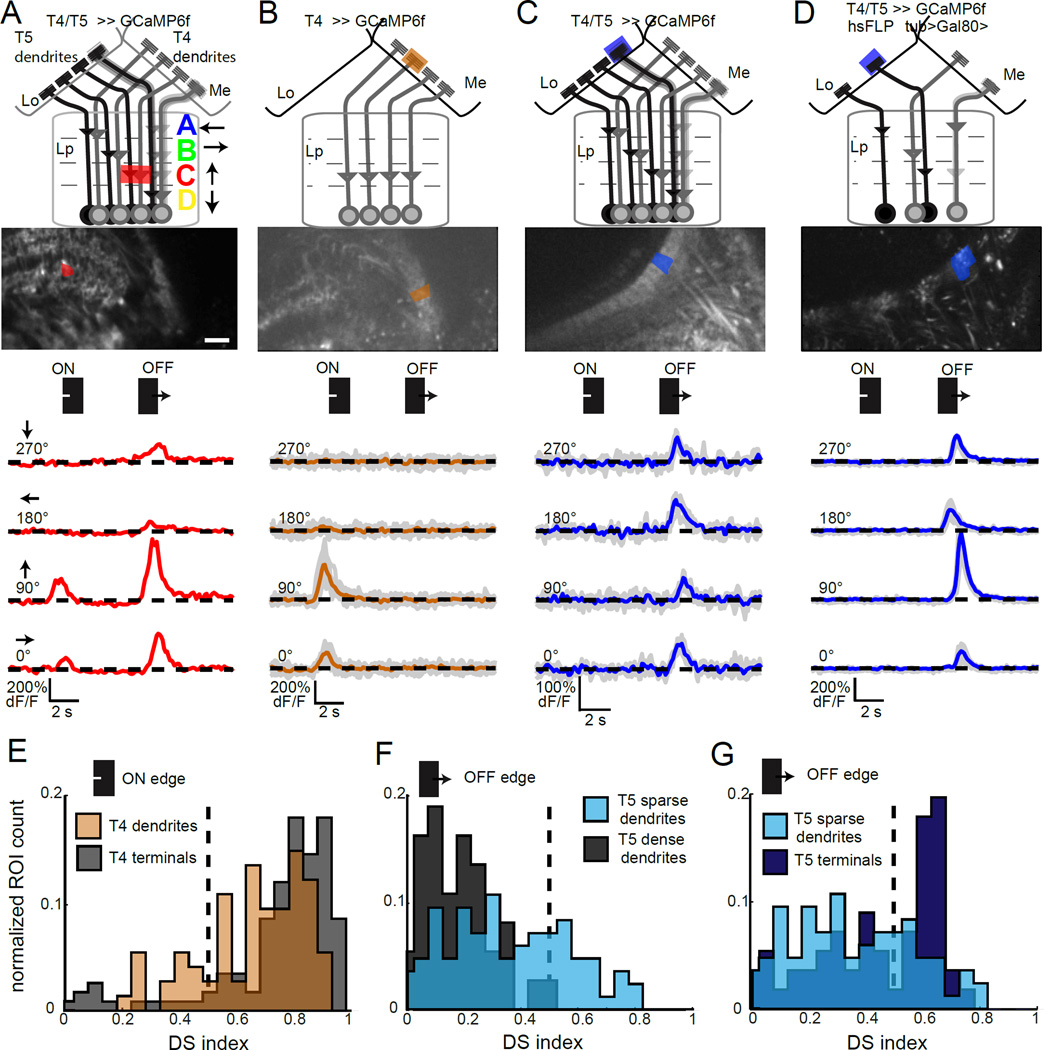
Figure 1. The dendrites of T4 and T5 are directionally tuned.
(A–D) Schematic of the T4 and T5 projection area, corresponding to the maximum intensity projection shown below, including the proximal medulla (Me), the lobula (Lo) and the lobula plate (Lp) with its four layers A–D (Maisak et al., 2013). Scale bar is 15 µm. A single region of interest (ROI) analyzed to extract the trace below is shaded. Traces display in vivo calcium responses to moving ON and OFF edges to one presentation of the stimulus (A) or the mean trace to repeated stimulus presentations, with individual response traces in grey (B–D). (E–G) Histograms plotting the normalized ROI count observed at each DS index value. Sample size (N = number of flies (ROIs)) was N = 12 (117) for T4 terminals in lobula plate layer C and N = 13 (74) for T4 dendrites in the proximal medulla (E), N = 13 (84) sparse T5 dendrites and N = 6 (37) dense T5 dendrites in (F) and N = 13 (84) sparse T5 dendrites and N = 10 (56) T5 axon terminals in layer C of the lobula plate (G). See also Figure S1.

