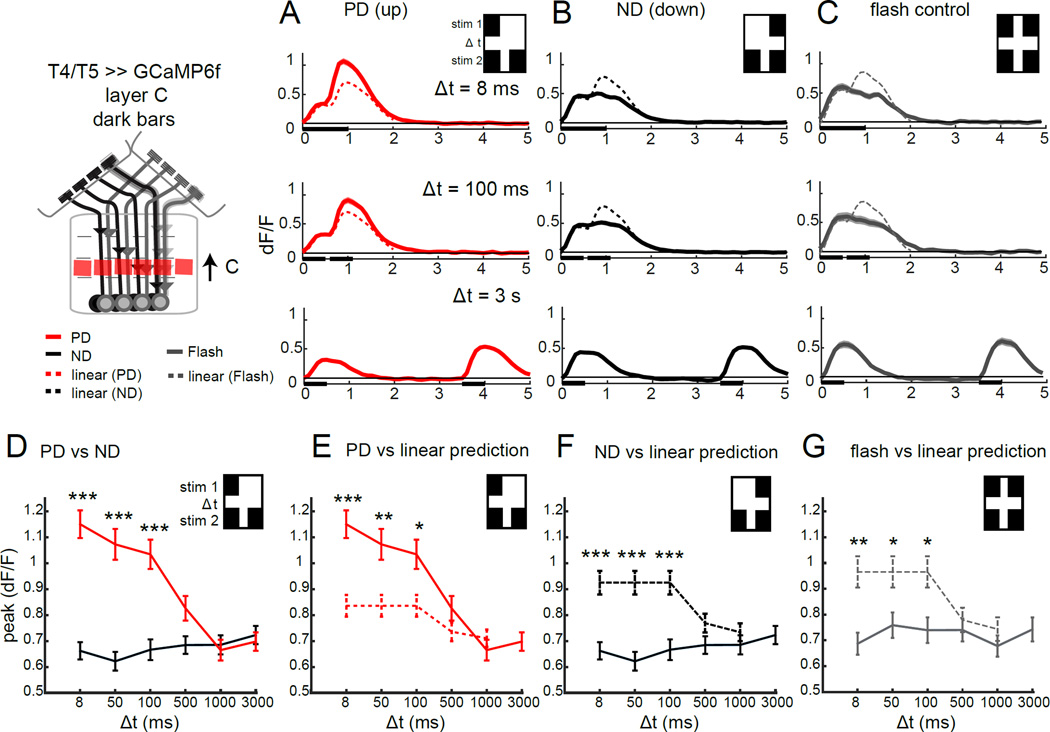
Figure 3. T5 responses selectively enhance preferred direction signals.
(A–C) Calcium signals imaged in the axon terminals of T4 and T5 in lobula plate layer C in response to a dark bar version of the stimuli described in Figure 2, at three different temporal delays. The dotted line represents the linear prediction based on the separate responses (recorded at Δt = 3 s). N = 21 (114) for axon terminals in (A,B) and N = 6 (35) in (C). (D–G) Quantification of the peak calcium response at various time delays, comparing PD and ND responses (D), PD responses and the linear prediction (E), ND responses and the linear prediction (F) and double flash control responses with the linear prediction (G), for axon terminals of T4 and T5 in layer C of the lobula plate. * p <0.05, **p<0.01, *** p<0.001, unpaired two tailed Student’s t-test with Bonferroni correction for multiple comparisons. See also Figure S3.

