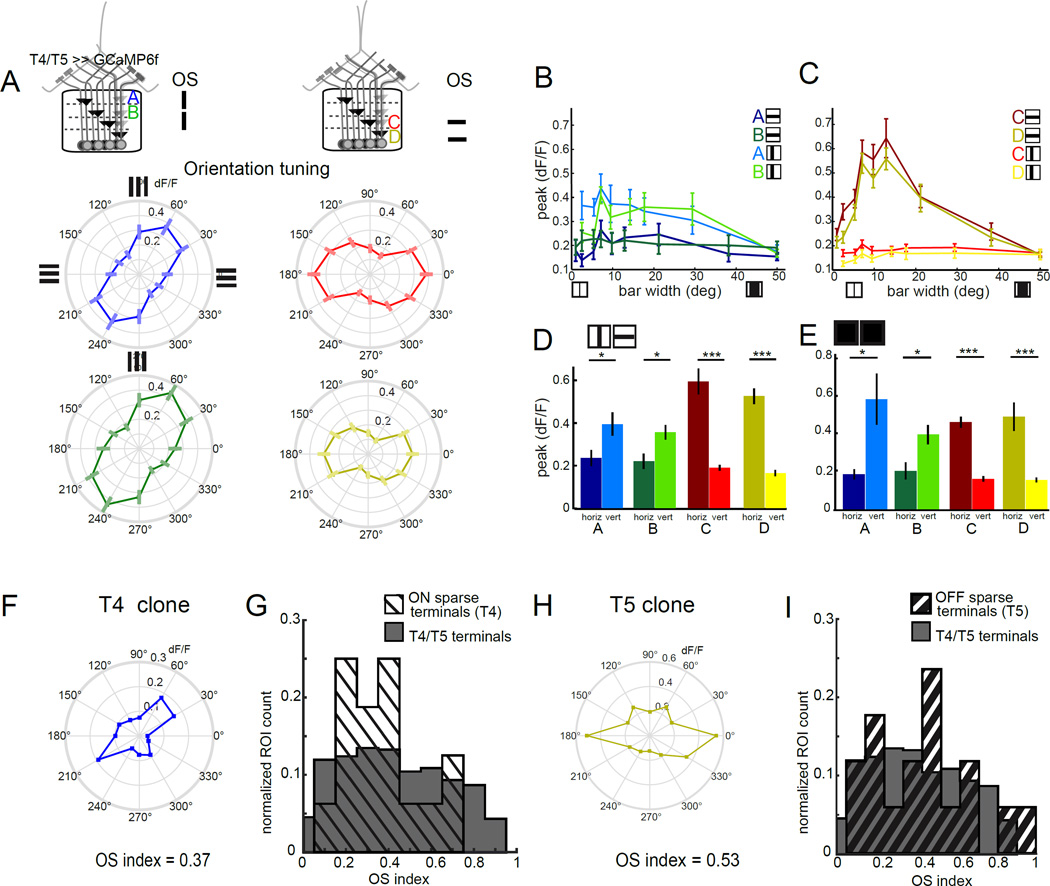
Figure 4. Individual T4 and T5 neurons are orientation tuned and exhibit surround antagonism.
(A) Polar plots displaying mean calcium responses in T4 and T5 axon terminals to static gratings of different orientations. Error bars are ±SEM. Layer A: N = 9(75), layer B: N = 9 (69), layer C: N = 9 (96), layer D: N = 9(78). (B,C) Peak calcium responses to horizontally or vertically oriented dark bars of variable width, imaged in T4 and T5 axon terminals in lobula plate layer A (N = 5 (9)) and layer B (N = 4 (10)) or layer C (N = 7 (38)) and layer D (N = 7 (25)). (D,E) Quantification of the difference in peak responses to horizontally and vertically oriented dark bars that were 7 to 15° wide (D) or light bars that were 5 to 10° wide (E), using averaged peak responses of the same ROIs as in panels (B,C) and Figure S4 B,C. * p<0.05, *** p<0.001, two tailed Student’s t-test. (F,H) Polar plots showing the mean calcium responses of a single T4 (F) or single T5 (H) cell. These same ROIs displayed direction tuning to 180° (T4) and 270° (T5) and thus represent putative layer A and D terminals, respectively (see Figure S4). (G,I) Normalized histogram comparing orientation selectivity index by ROI for clones with strong DS tuning for ON edges (G) or OFF edges (I) with ROIs obtained using the full T4/T5 GAL4 driver line. Individual clones were selected based on having a DS index > 0.5 for either moving ON or OFF edges respectively. Sample sizes were N = 4(16) flies (ROIs) for ON clones, N = 4 (17) for OFF clones and N = 9 (458) for the full T4/T5 pattern. See also Figure S4.

