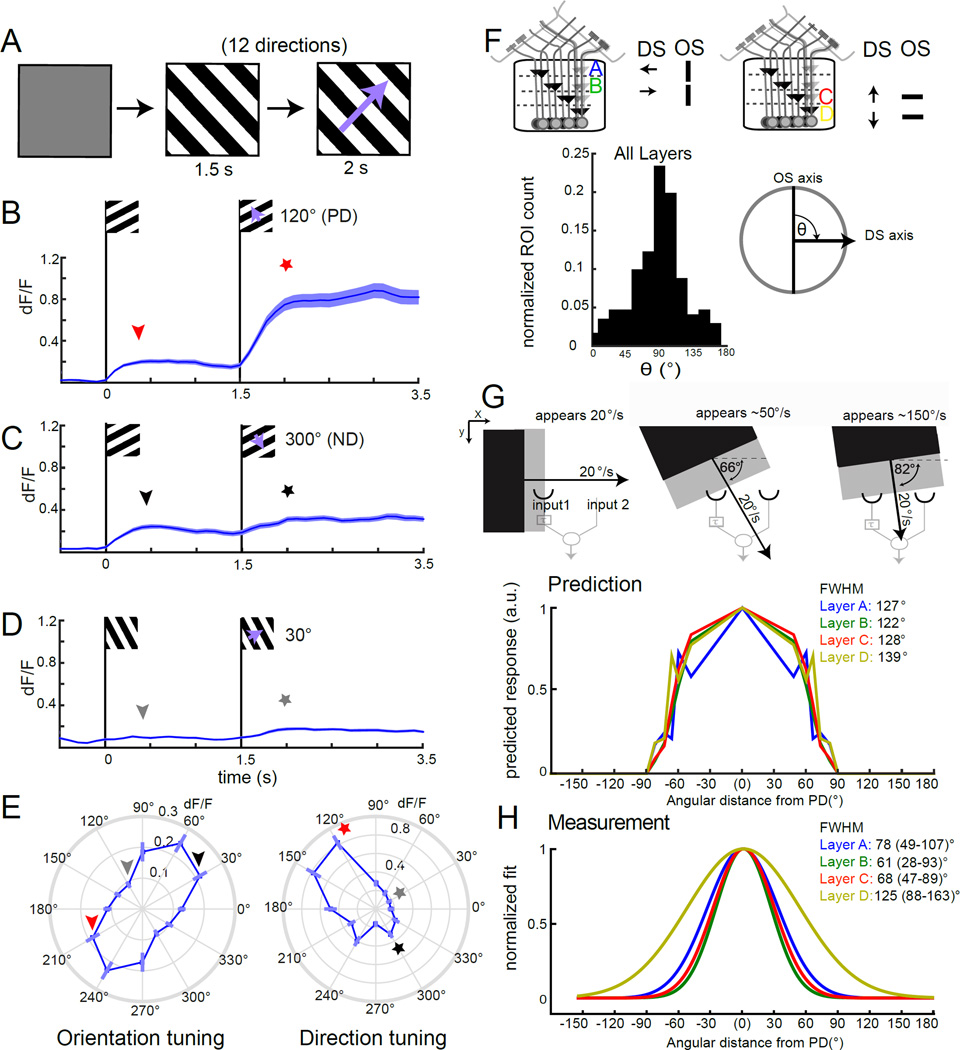
Figure 7. OS and DS tuning properties are orthogonal.
(A) Schematic of the stimulus design. Following an initial gray period, a static grating with a 20° spatial period appears at a particular orientation for 1.5 s. Then the grating moves orthogonal to the static pattern at 20°/s in one of 12 directions for 2 s. (B–D) Traces of mean calcium responses of T4 and T5 axon terminals of layer A in response to PD (120°) in (B), ND (300°) in (C) and an intermediate direction (30°) in (D). Shaded area is ±SEM. E, Polar plots displaying peak calcium responses of axon terminals in layer A to static gratings (reflecting orientation tuning) and to moving gratings (reflecting direction tuning). N = 14(108). The stars and arrowheads illustrate which epochs in (B–D) correspond to the values in (E). (F) Schematic illustration of the relationship between direction selectivity and orientation tuning in each of the four layers of the lobula plate. Histogram plotting the normalized ROI count for the angle θ between the OS and DS vector, ROIs were included in the analysis if they had sufficiently strong and DS responses to the moving grating (see Supplemental Experimental Procedures for details) (N ROIs = 171). (G) Schematic illustrating that the speed of a moving edge that is detected by a correlator will vary with motion direction. Predicted tuning width for T4 and T5 axon terminals calculated using measurements of PD responses to a grating moving at speeds ranging from 20°/s to 150°/s. (H) Gaussian fits to the measured tuning width of T4 and T5 axon terminals, normalized to the maximum response direction. Layer A: N = 14(108). Layer B: N = 15(106). Layer C: N = 15(135). Layer D: N = 15(109). FWHM denotes the full width at half maximum value. 95% confidence intervals are denoted in parentheses. For speed tuning measurements used to build the tuning width prediction in (G), Layer A: N = 3–14(11–108); Layer B: N = 3–15(17–106); Layer C: N = 4–15(25–135), and Layer D: N = 4–15(20–109). See also Figure S7.

