
FIGURE 2.
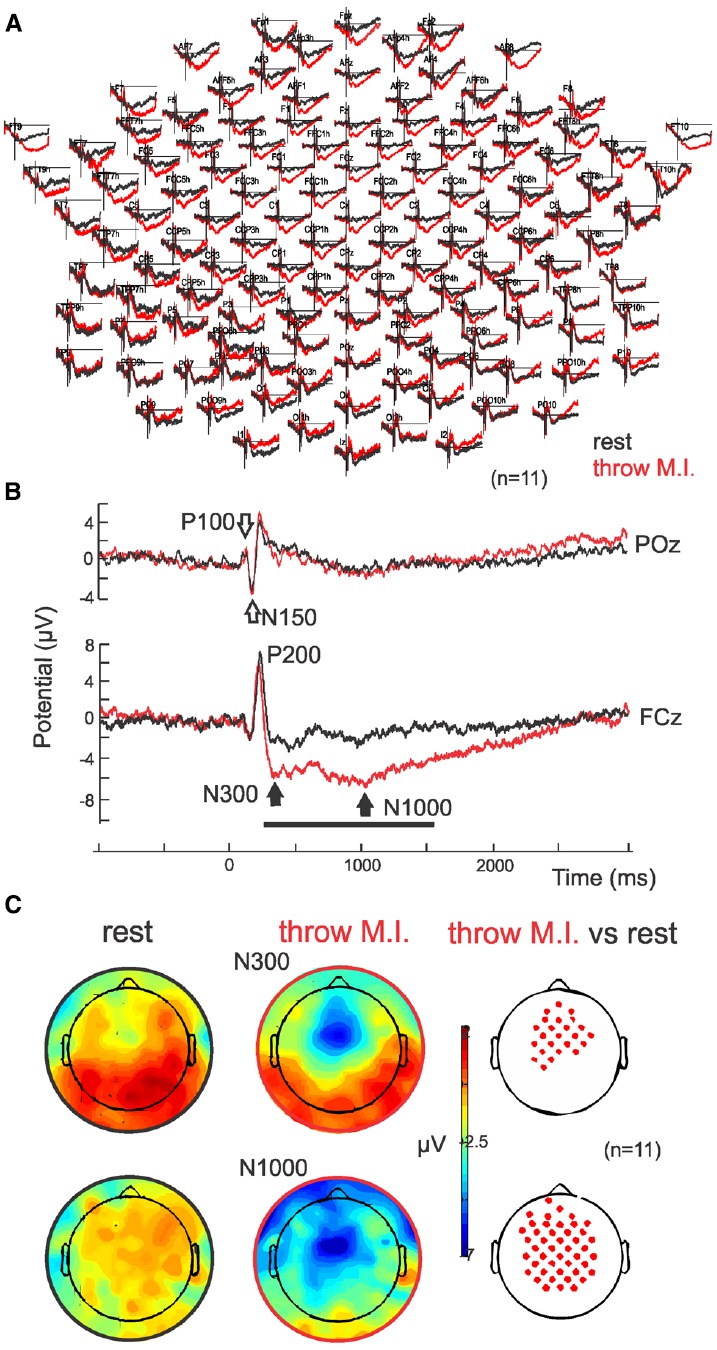
ERPs. (A) Grand average (n = 11) in full scalp array for the rest (black traces) and for the motor imagery of throwing (red traces). (B) ERP in POz: the classical visual P100–N150 complex is indicated with open arrows. ERP in representative electrode FCz: Note the negative wave characterized by a N300 and N1000 in the motor imagery of throwing condition. (C) Scalp potential topography of the N300 and N1000 components in both rest (left) and motor imagery of throwing (middle) conditions and their statistical differences (right; p > 0.05). Note that there is no special right or left laterality.