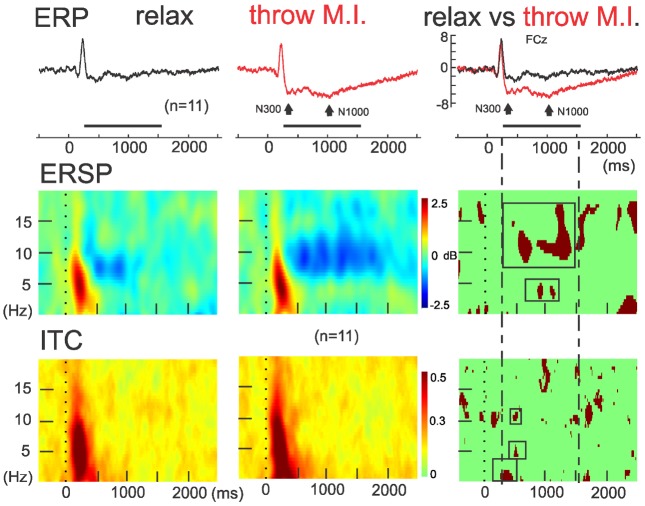
FIGURE 3.
ERSP and ITC time-frequency measurements in FCz. Concomitants to ERPs (up), grand averaging of ERSP (middle) and ITC (down) for the rest (left) and motor imagery of throwing (middle) condition and theirs statistical differences (on the right column). Note the red significant ERSP and ITC clusters enclosed in the intermittent lines during the significant negative ERP wave in FCz.

