
FIGURE 4.
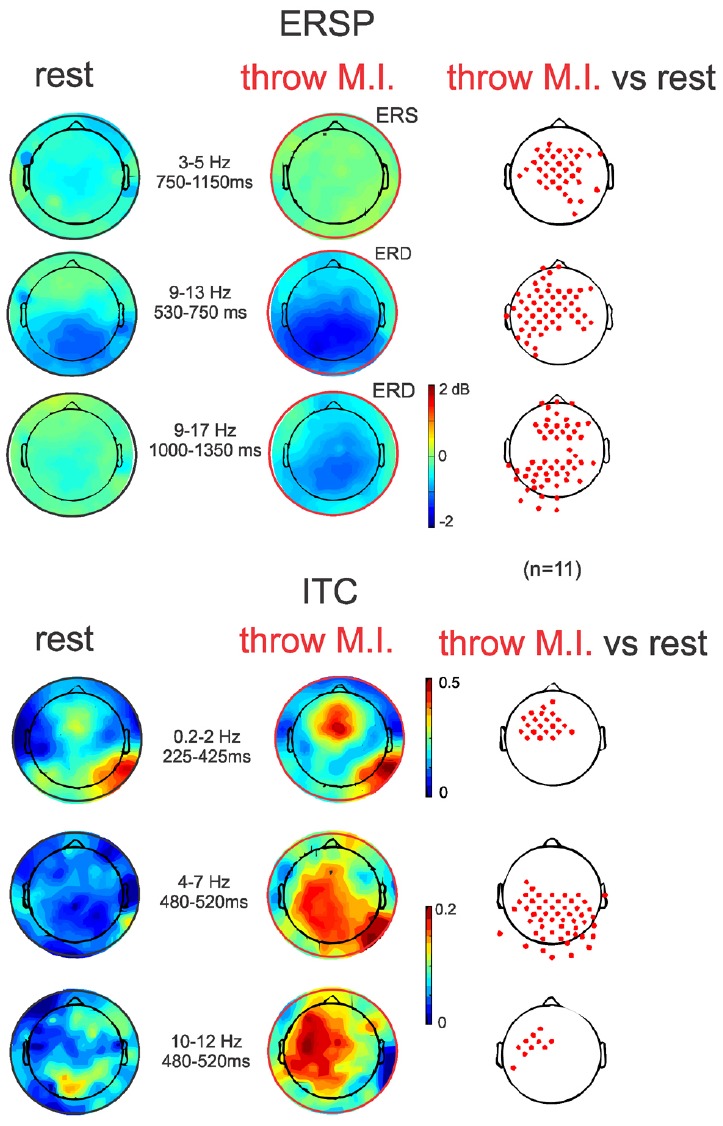
ERSP and ITC time-frequency measurements in full scalp array topography (n = 11). ERSPs (up) and ITCs (down) topographies during the ERSP and ITC clusters of significant differences between both experimental conditions indicated in Figure 3 (red clusters in Figure 3, right column). Topographical significant differences are plotted on the right column.