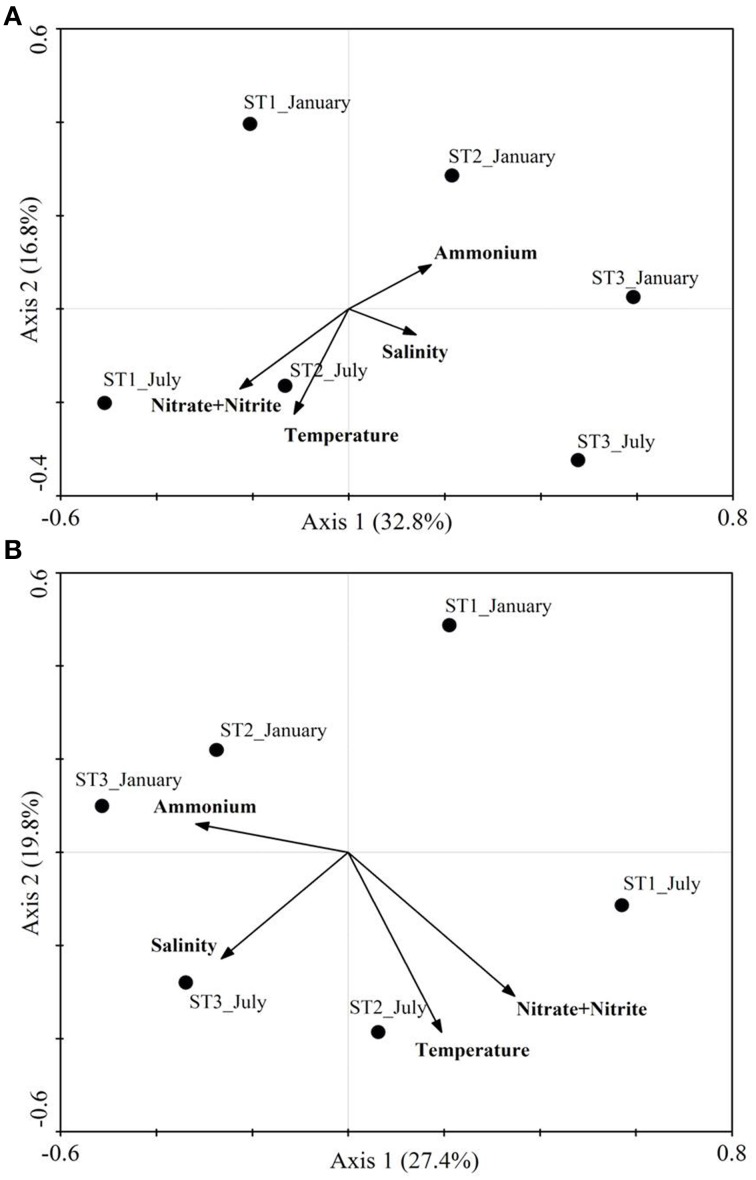
Figure 3.
Canonical correspondence analysis of amoA community composition of mat samples. (A) β-AOB amoA gene, (B) AOA amoA gene. Points represent the amoA gene community from seasonal samples at the indicated station. Arrows represent the relationship between environmental parameters with the amoA communities.

