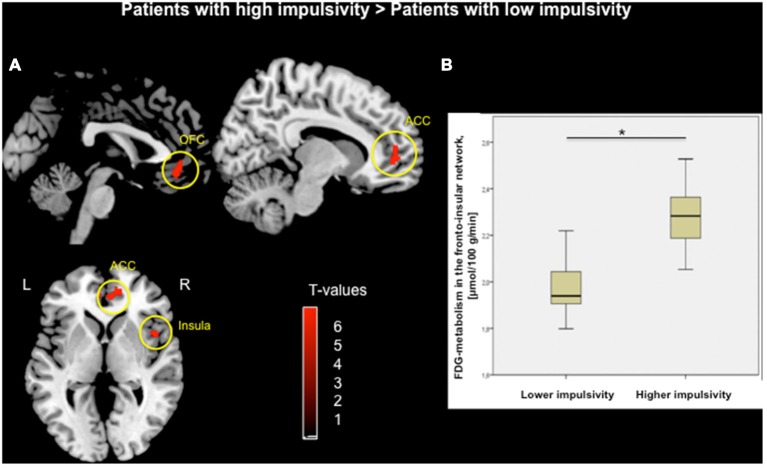
Figure 1.
(A) Voxel-wise group comparison of FDG-metabolism generated by independent t-test in SPM8. Red maps illustrate increased metabolism in PD patients with higher impulsivity compared to PD patients with lower impulsivity in the orbitofrontal cortex (OFC), anterior cingulate cortex (ACC), and right insula (p < 0.05, FWE corrected in cluster level, bars represent range of t-values). (B) Group difference based on the averaged FDG-metabolism of the fronto-insular network including the OFC, ACC, and insula within (*p < 0.001).

