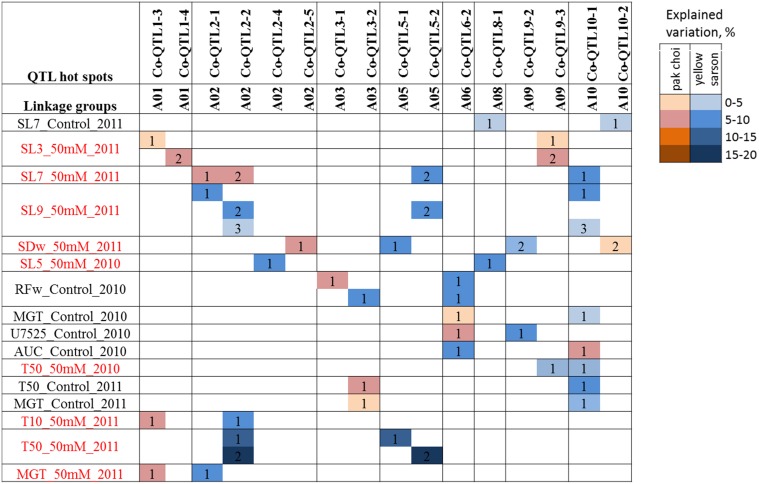
Figure 3.
Epistatic interactions of QTL regions for seed germination and seedling vigor traits. QTLs identified for different traits were tested in a pair of two QTLs for each trait. Identical numbers within a trait-row indicate a pair of QTLs with significant epistatic interaction (α = 0.05) for that particular trait. The color intensity increases with higher explained variance (%) of the interaction.

