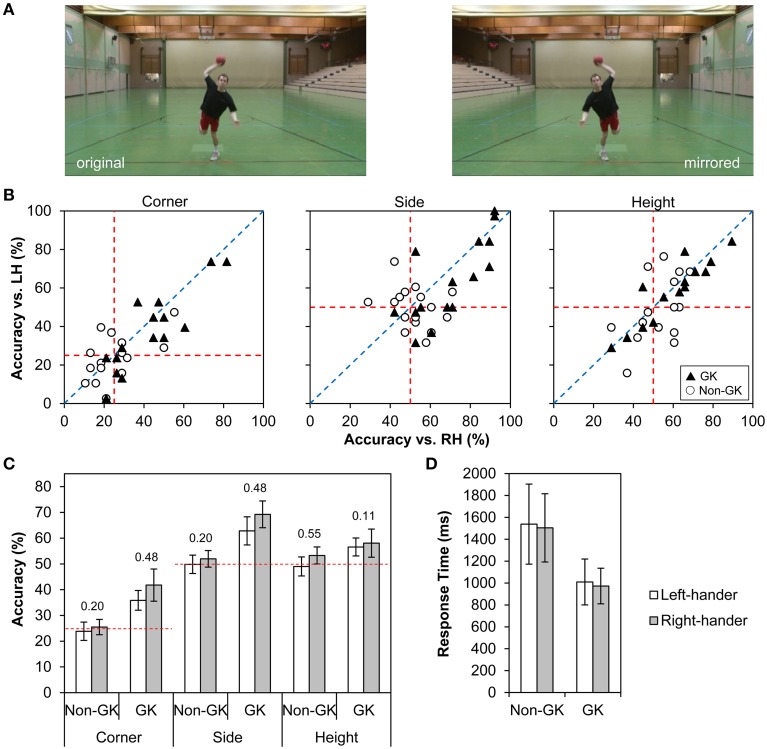
Figure 1.
(A) Screenshot of the final frame of a video in original and horizontally mirrored orientation. (B) Mean prediction accuracy against a right- (RH) vs. left-handed (LH) version of an otherwise identical penalty (i.e., 16 different videos) separately for corner, side and height predictions in goalkeepers (GK; ▴) and non-goalkeepers (Non-GK; ○). Symbols below the diagonal dotted blue line represent penalties where predictions were better against a right- than left-handed version (and vice versa). Red dotted lines indicate chance level for right- (vertical lines) and left-handed penalties (horizontal lines). Symbols toward the right (left) and/or above (below) these lines are indicative of above (below) chance performance against right- and left-handed penalties, respectively. (C) Mean prediction accuracy for corner, side and height predictions across all left- and right-handed penalties separately for goalkeepers (GK) and non-goalkeepers (Non-GK). Horizontal dashed red lines represent chance levels for corner (25%), side and height (both 50%) predictions. Error bars represent 95% confidence intervals associated with each mean value such that error bars not including the red lines indicate above chance performance. Values above bars are Cohen's standardized effect sizes dz for differences in accuracy against left- vs. right-handed penalties within goalkeepers and non-goalkeepers. (D) Mean response time (±95% confidence intervals) against left- and right-handed penalties separately for goalkeepers and non-goalkeepers.

