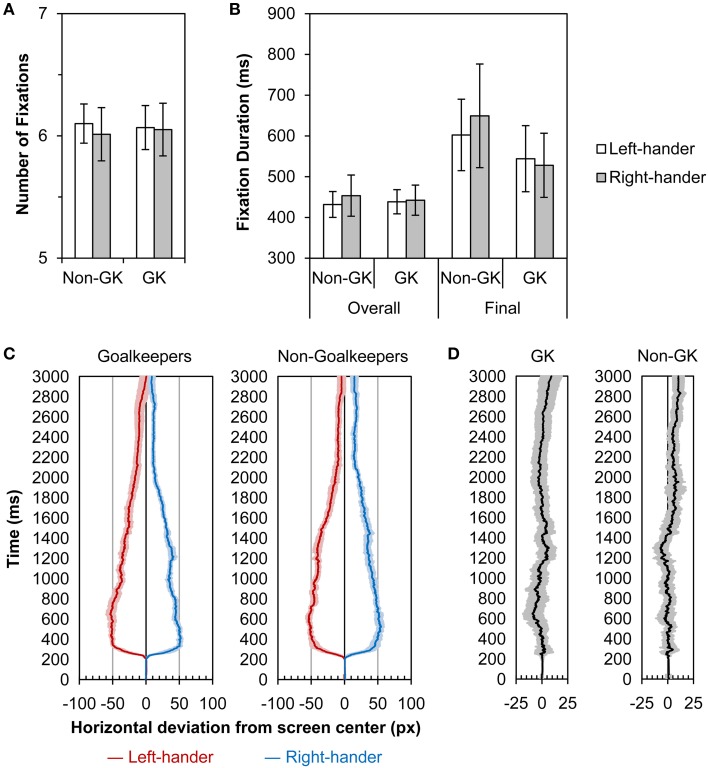
Figure 2.
(A) Mean number of fixations and (B) mean fixation duration overall and for final fixation against left- and right-handed penalties separately for goalkeepers and non-goalkeepers. In panels (A,B) error bars represent 95% confidence intervals associated with each mean. (C) Time-course of mean horizontal fixation deviation from the center of the screen against left- (red) vs. right-handed (blue) penalties separately for goalkeepers and non-goalkeepers. Red and blue shaded areas represent 95% confidence intervals associated with respective means. (D) Time-course of the difference in mean horizontal fixation deviation from the center of the screen between right- and left-handed penalties separately for goalkeepers (GK) and non-goalkeepers (Non-GK). Gray shaded areas represent 95% confidence intervals associated with mean differences.

