
Figure 3.
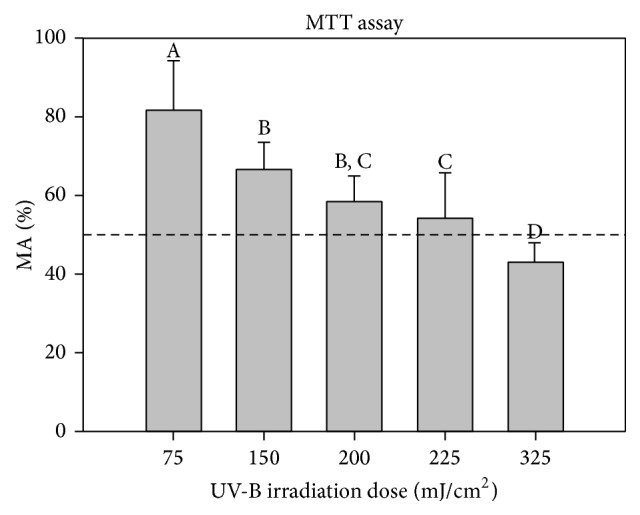
Effect of different UV-B doses on cell metabolic activity (MA) determined by MTT assay. Results are expressed as percentage (mean ± SD) of cell MA compared to nonirradiated cells. Statistical analysis: One-Way ANOVA with All Pairwise Multiple Comparisons by Holm-Sidak method: statistical differences between the samples are represented by different letters when P < 0.05.