
Figure 4.
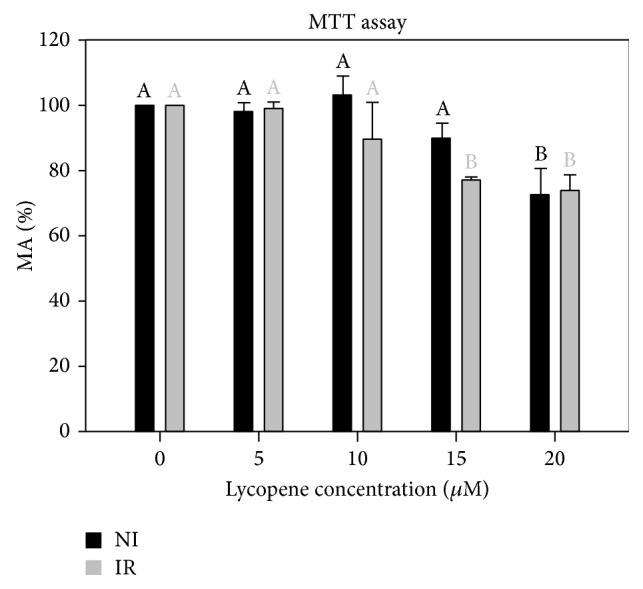
Effect of complexed lycopene preexposure on UV-B-irradiated (IR, 225 mJ/cm2) and nonirradiated (NI) HaCaT cells on cell MA measured by MTT assay. Results are expressed as percentage (mean ± SD of 3 independent experiments with 6 replicates each one). Statistical analysis: One-Way ANOVA with Multiple Comparisons versus Control Group (Holm-Sidak method): statistical differences between the samples within nonirradiated and irradiated groups (in respect to cells not exposed to lycopene) are represented by different letters when P < 0.05.