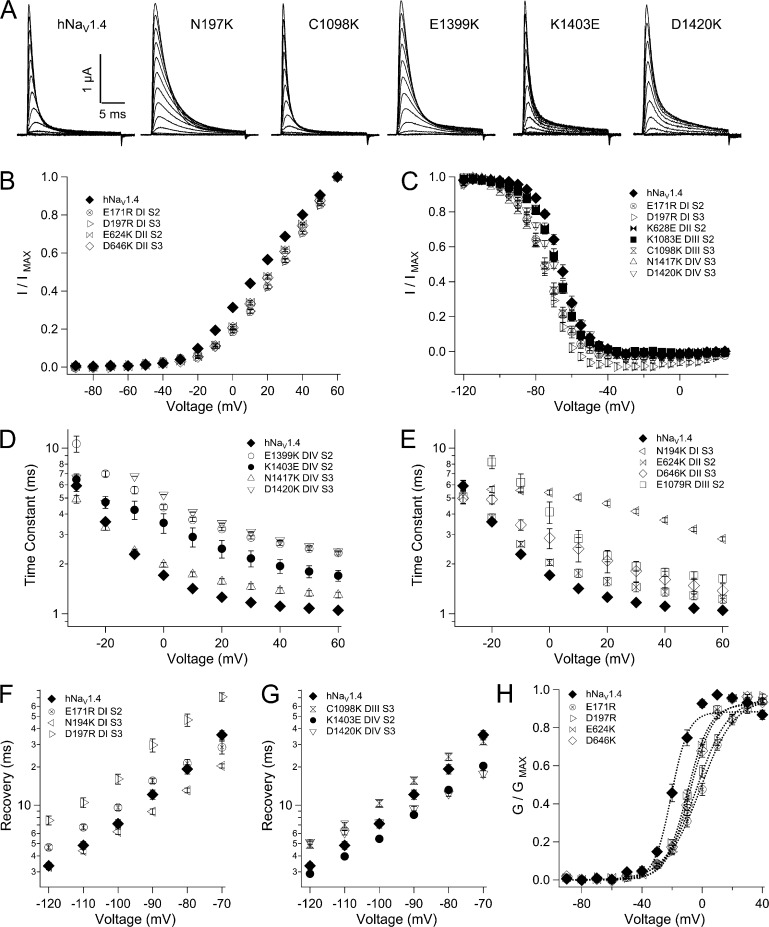
Figure 10.
Biophysical characterization of INC mutations. (A) Sodium currents in response to command depolarization to voltages from −90 to 60 mV. Effects of INC mutations are shown for activation (B), steady-state fast inactivation (C), entry into fast inactivation (D and E), and recovery (F and G). Legends identify residues and locus by domain and segment. Values represent mean ± SEM (error bars) from 10–23 experiments. The additional panel (H) is shown for g-V relations for hNaV1.4 and mutations of the INC in domains I and II. Boltzmann fits to each plot are shown by dotted lines.

