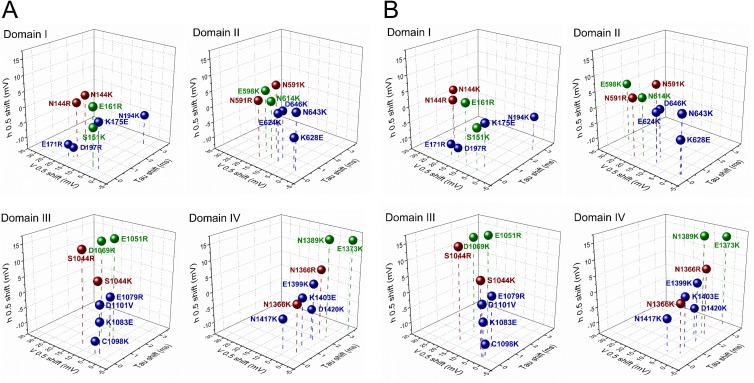
Figure 11.
Three-dimensional plot showing the effect of charge-reversing mutations of residues in ENC (green), HCR (red), and INC (blue) regions. Shown for each domain are shifts in inactivation kinetics at 20 mV (x axis), activation probability (y axis), and inactivation probability (z axis). Corrected values for V0.5 shifts shown in B are calculated from g-V relations of Table 3.

