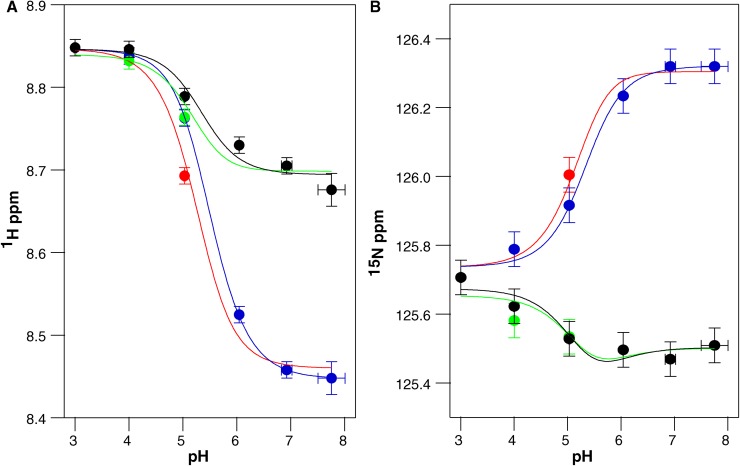
Figure 10.
The pH-dependent chemical shifts of Ala10 from drug-free E14D-EmrE fit to two significantly shifted pKa values. Proton (A) and nitrogen (B) chemical shifts were plotted independently as a function of pH. Blue and green symbols represent subunit A, and black and red symbols represent subunit B. Near the pKa, each subunit splits into a major and minor peak resulting in the multiple colors to represent the two states of each subunit. The data were globally fit to a double pKa model (solid lines; pKa = 5.2 ± 0.1 and 5.5 ± 0.1). The same pKa values are obtained if the major and minor states are independently fit to single pKa values.

