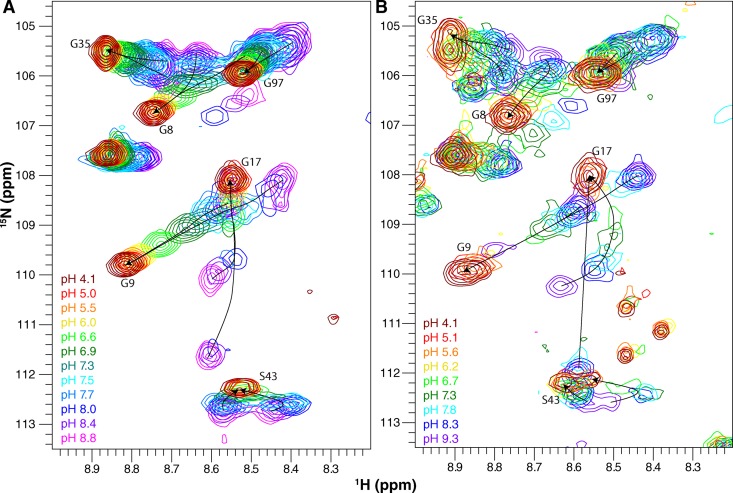
Figure 6.
Gly17 senses the protonation state of EmrE. Enlarged glycine region of the 1H-15N TROSY-HSQC spectrum for WT EmrE. Spectra were collected at 45°C (A) and 25°C (B). The pH of each spectrum is indicated by its color as designated in the figure. Lines highlight the movement of the peaks as the pH is lowered.

