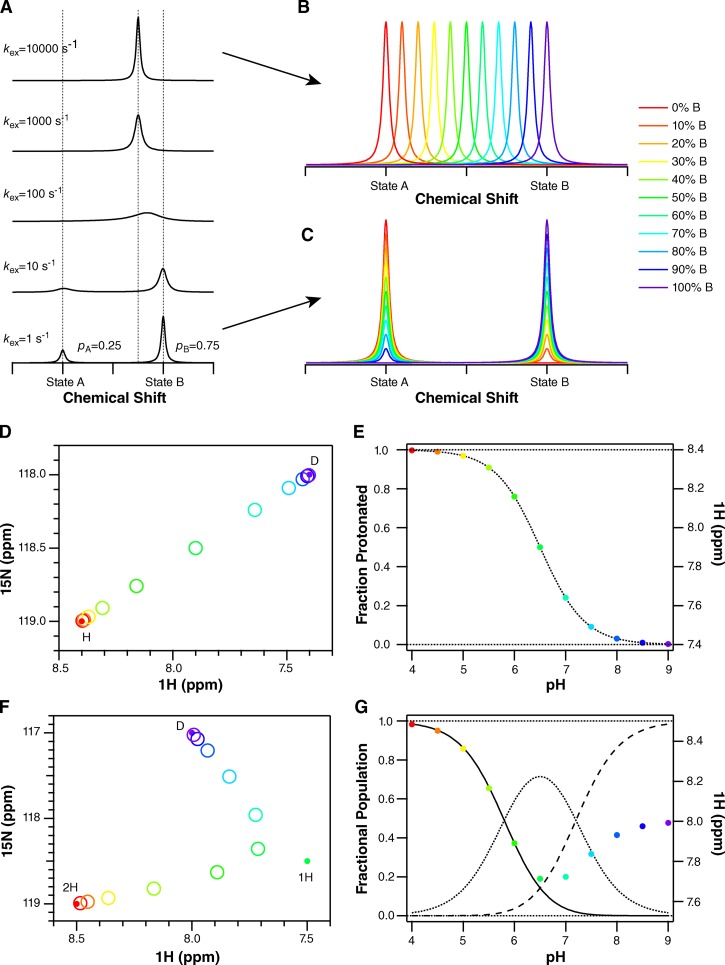
Figure 7.
Simulation of different NMR titration patterns. (A) For a single residue, each unique conformation or state of a protein will have a distinct chemical shift. When these conformations or states are able to exchange, the pattern observed in the NMR spectrum depends on the rate of the exchange process (kex) relative to the frequency difference between the chemical shifts of the two species (Δω). In A, one-dimensional NMR spectra are simulated for Δω = 100 Hz. When kex is much slower than Δω (bottom, slow-exchange regime), two peaks are observed at the unique chemical shifts of these two conformations or states. The area under each peak reflects the relative population of each, 25%/75% in this example. As the exchange rate increases, the peaks broaden and merge, eventually resulting in a single narrow peak at the population-weighted average chemical shift of the exchanging species (top, fast-exchange regime). NMR spectra are usually reported with axes in units of parts per million (ppm) to remove their dependence on the spectrometer field strength. However, the chemical shift actually corresponds to a frequency. For the spectra presented here, acquired on a 700-MHz NMR spectrometer, 1 ppm in proton corresponds to 700 Hz. (B) In the fast-exchange regime, where kex is fast compared with Δω, titration results in a shift in peak position, from the free to bound state as ligand is added and the relative population of the free and bound states changes. (C) In the slow-exchange regime, the free state disappears and the bound state appears during the course of a titration as ligand is added and the population shifts from free to bound. Intermediate exchange will result in a combination of peak shifting and broadening. Because proton on/off is generally fast, we expect (and observe) spectra where peaks shift position with pH. (D) In the case of two-state exchange from a protonated state, marked H, to a deprotonated state, marked D, the peak position in a two-dimensional spectrum will move along a line connecting the peaks corresponding to the fully protonated and fully deprotonated states as pH is changed. (E) Plotting the position of the peak (in ppm) as a function of pH will result in a classical binding curve, reflecting the nonlinear dependence of the fraction protonated on pH. Thus, the chemical shift can be analyzed in the same way as any other protein property that is sensitive to protonation-state changes. The exact equations are given in Materials and methods. (F) If the protein is exchanging between three states (2H, two protons bound; 1H, one proton bound; D, deprotonated, no protons bound), each with unique chemical shifts, then the peak position will reflect the population-weighted average of all three chemical shifts at each pH value. An example is shown for two protonation steps assuming non-interacting sites with pKa values separated by 1.4 pH units. The averaging of three states results in a curved path of the peak across the spectrum. (G) The fraction doubly protonated (solid line), singly protonated (dotted), and deprotonated (dashed) are shown along with the peak position (in parts per million) as a function of pH. Both transitions are clearly observed in the peak position, although the chemical-shift difference between states 1H and D is smaller along the proton dimension. Eq. 2 in Materials and methods takes into account the relative chemical shifts of all three states.

