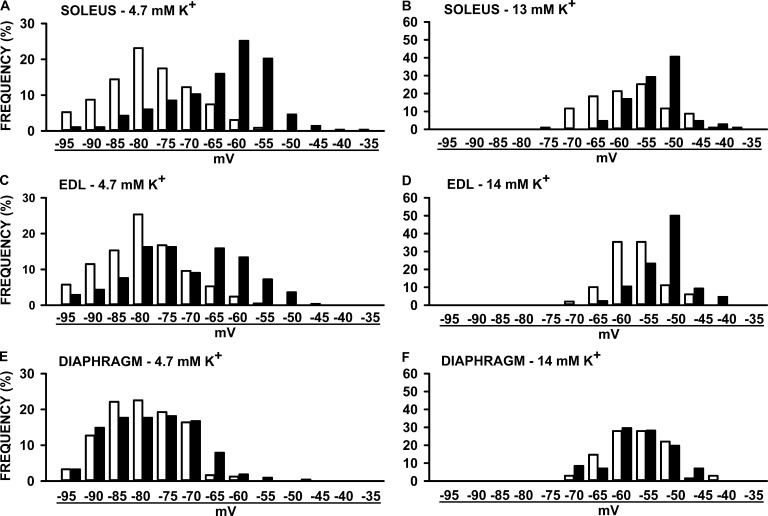
Figure 4.
The frequency distribution of resting EM was shifted toward less negative resting EM in the HyperKPP soleus and EDL but not in the diaphragm when compared with wild-type muscles. Resting EM values were separated in a bin of 5 mV, and the number of fibers in each bin is expressed as a percentage of the total number of tested fibers. The resting EM values under each pair of bars represent the upper bound of each bin. The total number of fibers were 209–278 (A, C, and E) for 4.7 mM K+ and 68–106 at the elevated [K+]e (B, D, and F).

