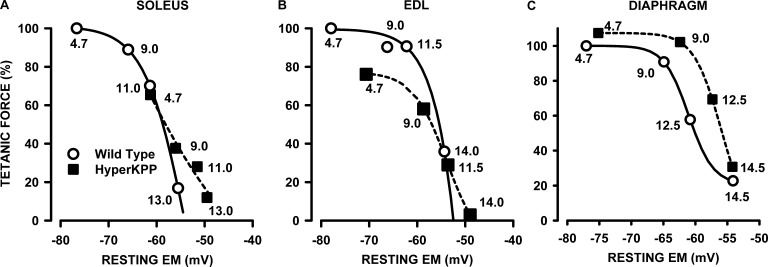
Figure 5.
Tetanic force versus resting EM relationships. (A–C) Relationships were made by first expressing all mean tetanic forces of wild-type and HyperKPP muscles at various [K+]e as a percentage of the mean tetanic force of wild-type muscles at 4.7 mM K+ (taken as the normal maximum force these muscles can generate), and then plotting the relative values against the resting EM shown in Fig. 2. The numbers beside each symbol indicate the [K+]e at which tetanic force and resting EM were measured. The curves were plotted after fitting the data points to the following sigmoidal relationship: where a, b, c, and d are constants.

