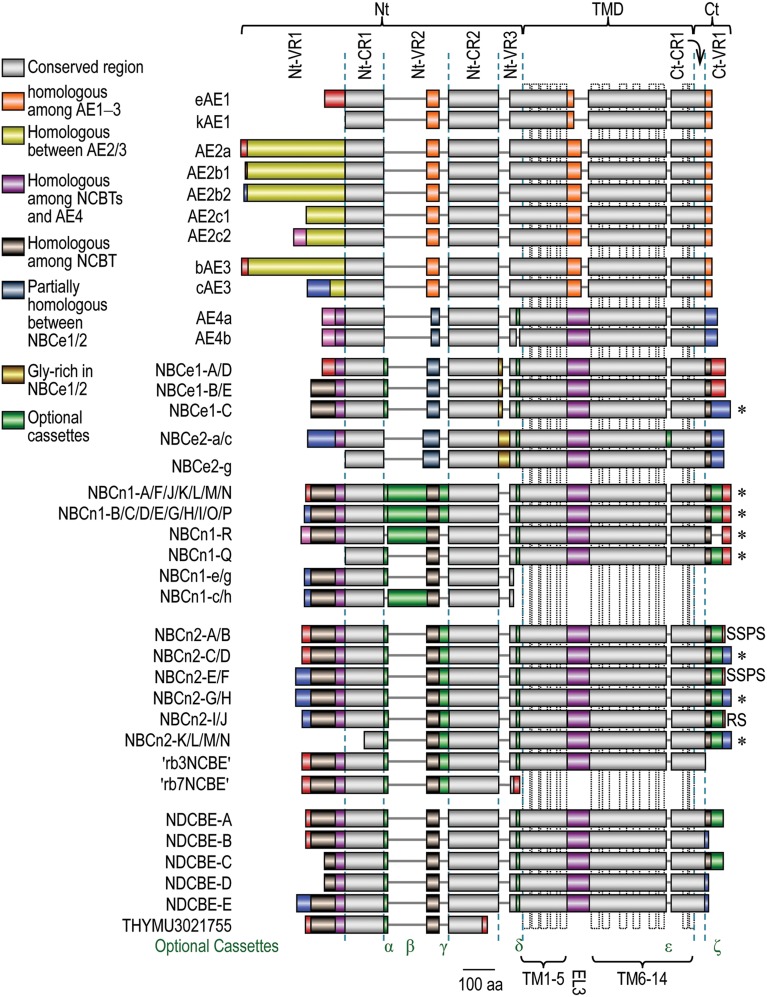
Figure 5.
Alignment of expression variants of SLC4 family transporters. The diagram was based upon a sequence alignment with Clustal Omega from the European Bioinformatics Institute Details. Accession numbers for the SLC4 variants are available in Supplemental Table S1. The colors denoting homology among different SLC4 members are shown in the legend. The extreme Nt and Ct ends of different SLC4 members with identical color pattern do not denote homology unless specified elsewhere in the main text. The dotted vertical boxes in TMD indicate the putative transmembrane helices shown in model A in Figure 2. *Proteins containing PDZ-binding motif at the Ct end.

